



Annual Report 2026
Proud History, Positive Impact
By the Numbers 2026
Chapter 8: Data Sources
On this page
Chapter 1: Undergraduate Studies
| 1.1a | Applications, Offers, Registrations, Selectivity and Yield of First-Year Undergraduates, 2016 to 2025 | All years’ data for applications and offers are based on annual Admissions Committee reports to Engineering Faculty Council (November), counting new admissions only, FT and PT, all years of study. Registrations only are from the U of T Historical Enrolment Count Tool. Parameters: Faculty = Applied Science & Engineering; Year = Fall terms for 2016–2025; Degree Type = Undergraduate (excludes students with special status); Year of Study - Undergraduate = Year 1; New Intake = Yes; Measure = Head Count. |
| 1.1b | Applications, Offers, Registrations, Selectivity and Yield of Domestic First-Year Undergraduates, 2016 to 2025 | All years’ data for applications and offers are based on annual Admissions Committee reports to Engineering Faculty Council (November), counting new admissions only, FT and PT, all years of study. Registrations only are from the U of T Historical Enrolment Count Tool. Parameters: Faculty = Applied Science & Engineering; Year = Fall terms for 2016–2025; Degree Type = Undergraduate (excludes students with special status); Year of Study - Undergraduate = Year 1; New Intake = Yes; Measure = Head Count; Tuition Fees / Domestic/International = Domestic. |
| 1.1c | Applications, Offers, Registrations, Selectivity and Yield of International First-Year Undergraduates, 2016 to 2025 | All years’ data for applications and offers are based on annual Admissions Committee reports to Engineering Faculty Council (November), counting new admissions only, FT and PT, all years of study. Registrations only are from the U of T Historical Enrolment Count Tool. Parameters: Faculty = Applied Science & Engineering; Year = Fall terms for 2016–2025; Degree Type = Undergraduate (excludes students with special status); Year of Study - Undergraduate = Year 1; New Intake = Yes; Measure = Head Count; Tuition Fees / Domestic/International = International. |
| 1.2a | Ontario Secondary School Averages of Incoming First-Year Undergraduates, 2016 to 2025 | Averages of incoming first-year students from Admissions Committee Report to Engineering Faculty Council (November). |
| 1.2b | Two-Year Retention Rate, 2014 to 2023 | All data from ROSI (Repository of Student Information). Retention rate is the proportion of students who successfully move on to second year within two years of their first entry into the program. |
| 1.3 | Incoming First-Year Undergraduates by Program, 2016–2017 to 2025–2026 | Student counts are from the U of T Historical Enrolment Count Tool. Parameters: Faculty = Applied Science & Engineering; Year = Fall terms for 2016–2025; Degree Type = Undergraduate (excludes students with special status); New Intake = Yes; Measure = Head Count; Programs of study based on [Program] field. |
| 1.4a | All Undergraduates by Program, 2016–2017 to 2025–2026 | Student counts are from the U of T Historical Enrolment Count Tool, including full-time students, part-time students and students on PEY Co-op. Parameters: Faculty = Applied Science & Engineering; Year = Fall terms for 2016–2025; Degree Type = Undergraduate (excludes students with special status); Year of Study - Undergraduate = Years 1–4; Measure = Head Count; Programs of study based on [Program] field. |
| 1.4b | All Undergraduates by Program, Year of Study and Professional Experience Year Co-op, 2025–2026 | Student counts are from the U of T Historical Enrolment Count Tool, including full-time students, part-time students and students on PEY Co-op. Parameters: Faculty = Applied Science & Engineering; Year = Fall 2025; Degree Type = Undergraduate (excludes students with special status); Year of Study - Undergraduate = Years 1–4; Programs of study based on [Program] field. |
| 1.4c | Enrolment in Engineering Science Majors, 2016–2017 to 2025–2026 | Student counts are from the U of T Historical Enrolment Count Tool. Parameters: Faculty = Applied Science & Engineering; Year = Fall 2025; Degree Type = Undergraduate (excludes students with special status); Associated Org = not AEPEY (excludes PEY Co-op); Year of Study - Undergraduate = Years 1–4; EngSci Majors based on [Program Option] field. |
| 1.5a | Undergraduate Student-to-Faculty Ratios by Academic Area, 2025–2026 | Student counts are from the U of T Historical Enrolment Count Tool. Parameters: Faculty = Applied Science & Engineering; Year = Fall 2025, Degree Type = Undergraduate (excludes students with special status); Associated Org = not AEPEY (excludes PEY Co-op); Measure = Head Count. Faculty Total does not include teaching done for Engineering by extra-divisional units (especially Arts & Science departments). Results are not adjusted for departmental contributions to shared first-year curriculum, Engineering Science or Engineering minors. Faculty counts are from U of T’s HRIS (Human Resources Information System) and are used on a slip-year basis: totals from July 2025 are used to compare with 2025–2026 student counts. Calculation includes tenured, tenure-stream and teaching-stream faculty. |
| 1.5b | Undergraduate Full-Time Equivalent Student-Faculty Ratios, 2016–2017 to 2025–2026 | Student counts are from the U of T Historical Enrolment Count Tool. Excludes students on PEY Co-op and students with special status. Parameters: Faculty = Applied Science & Engineering; Year = Fall 2025, Degree Type = Undergraduate; Associated Org = not AEPEY (to exclude PEY Co-op); Measure = Head Count. Does not include teaching done for Engineering by extra-divisional units (especially Arts & Science departments). Faculty counts are from U of T’s HRIS (Human Resources Information System) and are used on a slip-year basis: totals from July 2025 are used to compare with 2025–2026 student counts. Calculation includes tenured, tenure-stream and teaching-stream faculty. |
| 1.6a | Undergraduate Participation in Summer Research Opportunities, 2017 to 2026 | All data is provided by the Office of the Vice Dean, Undergraduate, Faculty of Applied Science & Engineering, with input from the Faculty’s departmental offices and the U of T Centre for International Experience. |
| 1.6b | Undergraduate Participation in Summer Research Opportunities by Academic Area, 2026 | All data is provided by the Office of the Vice Dean, Undergraduate, Faculty of Applied Science & Engineering, with input from the Faculty’s departmental offices and the U of T Centre for International Experience. |
| 1.7a | Number of Engineering Undergraduate Students Participating in PEY Co-op with Percentage Participation, 2016–2017 to 2025–2026 | Statistics provided by the Engineering Career Centre, Faculty of Applied Science & Engineering. |
| 1.7b | Number of Canadian and International PEY Co-op Positions, 2016–2017 to 2025–2026 | Statistics provided by the Engineering Career Centre, Faculty of Applied Science & Engineering. |
| 1.7c | Number of PEY Co-op Employers, 2016–2017 to 2025–2026 | Statistics provided by the Engineering Career Centre, Faculty of Applied Science & Engineering. |
| 1.8a | Number of Awards Received by Cohort with Total Number of Undergraduate Need-Based Award Recipients, 2016–2017 to 2025–2026 | Award data from the U of T Student Accounts Dashboard. Parameters: Faculty = Applied Science & Engineering; Transaction Type: Hierarchy Level 1 = Income, Hierarchy Level 2 = Awards – Undergraduate; Need vs Merit Based = Needs Based Awards; Program Level = Undergraduate; Enrolment Status = All (e.g. FINCA, CANC, etc.); Year of Study = Years 1–4 (exclude any N/A); Sessions include most recent (current) academic year except for the Summer semester; Measure = Dollar amount |
| 1.8b | Total Value of Undergraduate Financial Assistance and Percentage Distributed by Year of Study, 2016–2017 to 2025–2026 | Award data from the U of T Student Accounts Dashboard. Parameters: Faculty = Applied Science & Engineering; Transaction Type: Hierarchy Level 1 = Income, Hierarchy Level 2 = Awards – Undergraduate; Need vs Merit Based = Needs Based Awards; Program Level = Undergraduate; Enrolment Status = All (e.g. FINCA, CANC, etc.); Year of Study = Years 1–4 (exclude any N/A); Sessions include most recent (current) academic year except for the Summer semester; Measure = Distinct student count |
| 1.9 | Undergraduate Degrees Awarded by Program, 2016–2017 to 2025–2026 | All data from ROSI download: 5EA (Graduated Students); Faculty = APSC (Applied Science & Engineering). Includes Fall (Nov), Spring (March) and Summer (June) convocations. |
| 1.10a | Number of Students and Percentage of Class Graduating with Honours, 2017 to 2026 | All data from ROSI download: 5EA (Graduated Students); Degree Citation Code = HON (Honours) or HHO (High Honours). |
| 1.10b | Number of Students on the Dean’s Honour List by Term and Academic Area, Fall 2021 to Winter 2026 | All data from ROSI: Award Code = APHON. |
| 1.11a | Number of Students and Percentage of Graduating Class Completing an Engineering Minor, 2016–2017 to 2025–2026 | Data provided by the Cross-Disciplinary Programs Office, Faculty of Applied Science & Engineering |
| 1.11b | Students Graduating with an Engineering Business Minor or Certificate, 2016–2017 to 2025–2026 | Data provided by the Cross-Disciplinary Programs Office, Faculty of Applied Science & Engineering |
| 1.12 | New Undergraduate Courses Launched, 2025–2026 | Data provided by the Vice-Dean Undergraduate Studies, Faculty of Applied Science & Engineering. |
Chapter 2: Graduate Studies
| 2.1a | Domestic and International MASc Students: Applications, Offers, Registrations, Selectivity and Yield, 2016–2017 to 2025–2026 | All data from ROSI download: 4BEG (Graduate Admissions Statistics) |
| 2.1b | Domestic and International PhD Students: Applications, Offers, Registrations, Selectivity and Yield, 2016–2017 to 2025–2026 | All data from ROSI download: 4BEG (Graduate Admissions Statistics). Students who have fast-tracked from MEng or MASc programs into PhD programs are calculated separately (see Fig. 2.7a) but have been included in this figure as applications, offers and admissions to more accurately reflect total PhD student intake. |
| 2.1c | Domestic and International MEng and MHSc Students: Applications, Offers, Registrations, Selectivity and Yield, 2016–2017 to 2025–2026 | All data from ROSI download: 4BEG (Graduate Admissions Statistics) |
| 2.2a | Graduate Students by Degree Type, 2016–2017 to 2025–2026 | Student counts are from the U of T Historical Enrolment Count Tool. Parameters: Faculty = Applied Science & Engineering; Year = Fall terms for 2016–2025; Degree Type = Doctoral & Masters (excludes students with special status); Measure = Head Count. |
| 2.2b | Graduate Enrolment by Full-Time Equivalent (FTE) and Headcount (HC) by Academic Area, 2016–2017 to 2025–2026 | Student counts are from the U of T Historical Enrolment Count Tool. Parameters: Faculty = Applied Science & Engineering; Degree Type = Doctoral & Masters (excludes students with special status); Measure = Head Count or Total FTE. Headcounts are reported for all Fall terms from 2016–2025. FTEs are counted by academic year as reported in the HECT (May to April). |
| 2.3a | PhD Enrolment by Academic Unit (Headcount), 2016–2017 to 2025–2026 | Student counts are from the U of T Historical Enrolment Count Tool. Parameters: Faculty = Applied Science & Engineering; Year = Fall terms for 2016–2025; Degree Type = Doctoral Program; Measure = Head Count. |
| 2.3b | MASc Enrolment by Academic Unit (Headcount), 2016–2017 to 2025–2026 | Student counts are from the U of T Historical Enrolment Count Tool. Parameters: Faculty = Applied Science & Engineering; Year = Fall terms for 2016–2025; Degree Type = Masters - Doctoral Stream; Measure = Head Count. |
| 2.3c | MEng/MHSc Enrolment by Academic Unit (Headcount), 2016–2017 to 2025–2026 | Student counts are from the U of T Historical Enrolment Count Tool. Parameters: Faculty = Applied Science & Engineering; Year = Fall terms for 2016–2025; Degree Type = Masters - Professional Stream; Measure = Head Count. |
| 2.4a | Graduate and Undergraduate Full-Time Equivalent Student-to-Faculty Ratios, 2016–2017 to 2025–2026 | Student counts are from the U of T Historical Enrolment Count Tool. Undergraduate Parameters: Faculty = Applied Science & Engineering; Year = Fall terms 2016–2025; Associated Org = not AEPEY (excludes PEY Co-op); Degree Type = Undergraduate (excludes students with special status); Measure = Head Count. To calculate Undergraduate FTEs, part-time students are counted as 0.3 FTE. Graduate Parameters: Faculty = Applied Science & Engineering; Year = Fall terms 2016–2025; Measure = Total FTE; Degree Type = Doctoral & Masters (excludes students with special status). Faculty counts are from U of T’s HRIS (Human Resources Information System) and are used on a slip-year basis: totals from July 2025 are used to compare with 2025–2026 student counts. Graduate ratios include only tenured and tenure-stream faculty; Undergraduate ratios also include teaching stream faculty. |
| 2.4b | Full-Time Equivalent Graduate Student-to-Faculty Ratios by Academic Area and Degree Type, 2025–2026 | Student counts are from the U of T Historical Enrolment Count Tool. Parameters: Faculty = Applied Science & Engineering; Year = Fall 2025; Degree Type = Doctoral & Masters (excludes students with special status); Measure = Total FTE. The number of graduate students per department is adjusted as per the budget calculation for inter-departmental graduate student supervision. Faculty counts are from U of T’s HRIS (Human Resources Information System) and are used on a slip-year basis: totals from July 2025 are used to compare with 2025–2026 student counts. Includes tenured and tenure-stream faculty only. |
| 2.5a | Graduate Student Funding by Category, 2015–2016 to 2024–2025 | Data from the U of T Student Accounts Dashboard. Parameters: Faculty = Applied Science & Engineering; Transaction Type: Hierarchy Level 1 = Income, Hierarchy Level 2 = Awards – Grad, HR Other, Stipend, UT Employment; excludes Awards – Undergraduate, Waiver. Student funding reported by academic year (September to August). |
| 2.5b | Graduate Student Funding by Category and Academic Area, 2024–2025 | Data obtained from the U of T Student Accounts Dashboard. Parameters: Faculty = Applied Science & Engineering; Transaction Type: Hierarchy Level 1 = Income, Hierarchy Level 2 = Awards – Grad, HR Other, Stipend, UT Employment; excludes Awards – Undergraduate, Waiver. Student funding reported by academic year (September to August). |
| 2.6a | Total Graduate Student Scholarships by Source, 2015–2016 to 2024–2025 | Data from the U of T Student Accounts Dashboard. Parameters: Faculty = Applied Science & Engineering; Transaction Type: Hierarchy Level 1 = Income, Hierarchy Level 2 = Awards – Grad. Student funding reported by academic year (September to August). |
| 2.6b | Number of NSERC and CIHR Graduate Student Award Recipients by Academic Area, 2015–2016 to 2024–2025 | Data from the U of T Student Accounts Dashboard. Parameters: Faculty = Applied Science & Engineering; Transaction Type: Hierarchy Level 1 = Income, Hierarchy Level 2 = Awards – Grad; Award Income Source = Federal — Natural Sciences and Engineering Research Council; Measure = Distinct Student Count. Student funding reported by academic year (September to August). |
| 2.7a | Number of Students Fast-Tracked from Masters to PhD by Academic Area, 2016–2017 to 2025–2026 | All data from ROSI download: 4FF (Student Registrations). Fast-tracked students are identified by POSt codes that end in ‘PHD U’ and are counted when prior session POSt code was a Master’s degree (MASc or MEng). To reflect fast-tracking practice, an academic year is defined as Summer-Fall-Winter (May to April). |
| 2.7b | Number of Direct-Entry PhD students by Academic Area, 2016–2017 to 2025–2026 | All data from ROSI download: 4FF (Student Registrations). Include all PhD students where prior session POSt code was blank or AE NDEGP (recently completed undergraduate). Reported by academic year defined as Summer-Fall-Winter (May to April). |
| 2.8a | Time to Completion for PhD, MASc, MEng and MHSc Students, 2016–2017 to 2025–2026 | All data from ROSI download: 4BEA (Years to Graduate), originally created for Ontario Council of Graduate Studies (OCGS) reporting purposes. The data reflects median values based on the total number of terms in which a student is registered. Leaves, lapses and (in most cases) the term in which the convocation occurs are excluded. Where a student is fast-tracked from a Masters degree into a PhD, the total time for both programs is counted. Full-time, extended full-time and part-time MEng students are distinguished for greater clarity and accuracy. |
| 2.8b to 2.8h | Time to Completion for Graduate Students by Academic Area, 2016–2017 to 2025–2026 | All data from ROSI 4BEA downloads (Years to Graduate), originally created for Ontario Council of Graduate Studies (OCGS) reporting purposes. The data reflects median values based on the total number of terms in which a student is registered. Leaves, lapses and (in most cases) the term in which the convocation occurs are excluded. Where a student is fast-tracked from a Masters degree into a PhD, the total time for both programs is counted. Full-time, extended full-time and part-time MEng students are distinguished for greater clarity and accuracy. |
| 2.9 | Graduate Degrees Awarded by Degree Type, 2016–2017 to 2025–2026 | All data from ROSI download: 5EA (Graduated Students); Faculty = APSC (Applied Science & Engineering). |
| 2.10 | New Graduate Courses Approved, 2025–2026 | Data provided by the Vice-Dean Graduate Studies, Faculty of Applied Science & Engineering. |
Chapter 3: Community
| 3.1 | Continent of Origin: Undergraduate Students, 2025–2026 | Student counts are from the U of T Historical Enrolment Count Tool. Parameters: Faculty = Applied Science & Engineering; Year = Fall 2025; Degree Type = Undergraduate (excludes students with special status); Measure = Head Count; Calculations based on Continent / Country of Citizenship parameter. |
| 3.2a | Incoming First-Year Undergraduates with Percentage of Women, 2016 to 2025 | Student counts are from the U of T Historical Enrolment Count Tool. Parameters: Faculty = Applied Science & Engineering; Year = Fall terms for 2016–2025; Degree Type = Undergraduate (excludes students with special status); New Intake = Yes; Year of Study - Undergraduate = 1; Measure = Head Count. Percentage of women students is calculated using the [Gender] parameter. The options to report "another gender" or to not report gender were added in 2017. |
| 3.2b | Incoming First-Year Undergraduates with Percentage of International Students, 2016 to 2025 | Student counts are from the U of T Historical Enrolment Count Tool. Parameters: Faculty = Applied Science & Engineering; Year = Fall terms for 2016–2025; Degree Type = Undergraduate (excludes students with special status); New Intake = Yes; Year of Study - Undergraduate = 1; Measure = Head Count; Percentage of international students is calculated using the Tuition Fees / Domestic/International parameter. |
| 3.2c | Incoming First-Year Domestic and International Undergraduates, 2016 to 2025 | Student counts are from the U of T Enrolment Master Files, source of the Historical Enrolment Count Tool. Includes new and returning students. Parameters: Faculty = Applied Science & Engineering; Year = Fall terms for 2016–2025; Degree Type = Undergraduate (excludes students with special status); Year of Study - Undergraduate = Year 1; New Intake = Yes; Measure = Head Count |
| 3.3a | Undergraduate Enrolment with Percentage of Women, 2016–2017 to 2025–2026 | Student counts are from the U of T Historical Enrolment Count Tool. Parameters: Faculty = Applied Science & Engineering; Year = Fall terms for 2016–2025; Degree Type = Undergraduate (excludes students with special status); Measure = Head Count. Percentage of women students is calculated using the [Gender] parameter. The options to report "another gender" or to not report gender were added in 2017. |
| 3.3b | Percentage of Women by Undergraduate Program, 2016–2017 to 2025–2026 | Student counts are from the U of T Historical Enrolment Count Tool. Parameters: Faculty = Applied Science & Engineering; Year = Fall terms for 2016–2025; Degree Type = Undergraduate (excludes students with special status); Measure = Head Count; Gender = Female; Programs of study based on [Program] field. |
| 3.3c | Undergraduate Enrolment with Percentage of International Students, 2016–2017 to 2025–2026 | Student counts are from the U of T Historical Enrolment Count Tool. Parameters: Faculty = Applied Science & Engineering; Year = Fall terms for 2016–2025; Degree Type = Undergraduate (excludes students with special status); Measure = Head Count; Percentage of international students is calculated using the Tuition Fees / Domestic/International parameter. |
| 3.3d | Percentage of International Students by Undergraduate Program, 2016–2017 to 2025–2026 | Student counts are from the U of T Historical Enrolment Count Tool. Parameters: Faculty = Applied Science & Engineering; Year = Fall terms for 2016–2025; Degree Type = Undergraduate (excludes students with special status); Measure = Head Count; Percentage of international students is calculated using the Tuition Fees / Domestic/International parameter; Programs of study based on [Program] field. |
| 3.4 | Undergraduate Degrees Awarded by Gender, 2016–2017 to 2025–2026 | All data from ROSI download: 5EA (Graduated Students); Faculty = APSC (Applied Science & Engineering). Includes Fall (Nov), Spring (March) and Summer (June) convocations. |
| 3.5 | Continent of Origin: Graduate Students, 2025–2026 | Student counts are from the U of T Historical Enrolment Count Tool. Parameters: Faculty = Applied Science & Engineering; Year = Fall 2025; Degree Type = Doctoral & Masters (excludes students with special status); Measure = Head Count; Calculations based on Continent / Country of Citizenship parameter. |
| 3.6a | Graduate Students by Degree Type and Gender with Percentage of Women, 2016–2017 to 2025–2026 | Student counts are from the U of T Historical Enrolment Count Tool. Parameters: Faculty = Applied Science & Engineering; Year = Fall terms for 2016–2025; Degree Type = Doctoral & Masters (excludes students with special status); Measure = Head Count. Percentage of women students is calculated using the [Gender] parameter. The options to report "another gender" or to not report gender were added in 2017. |
| 3.6b | Graduate Students by Degree Type and Domestic/International Status with Percentage of International Students, 2016–2017 to 2025–2026 | Student counts are from the U of T Historical Enrolment Count Tool and exclude special status students. Parameters: Faculty = Applied Science & Engineering; Year = Fall terms for 2016–2025; Degree Type = Doctoral & Masters (excludes students with special status); Measure = Head Count. Percentage of international students is calculated using the Tuition Fees / Domestic/International parameter. |
| 3.7 | Graduate Degrees Awarded by Gender, 2016–2017 to 2025–2026 | All data from ROSI download: 5EA (Graduated Students); Faculty = APSC (Applied Science & Engineering). |
| 3.8a | Engineering Undergraduate and Graduate Clubs and Teams, 2025–2026 | Information from the Centralized Process for Student Initiative Funding (CPSIF). |
| 3.8b | Funding for Student Clubs and Teams Through the Centralized Process for Student Initiative Funding (CPSIF) by Academic Area or Organization (in thousands), 2025–2026 | Information from the Centralized Process for Student Initiative Funding (CPSIF) |
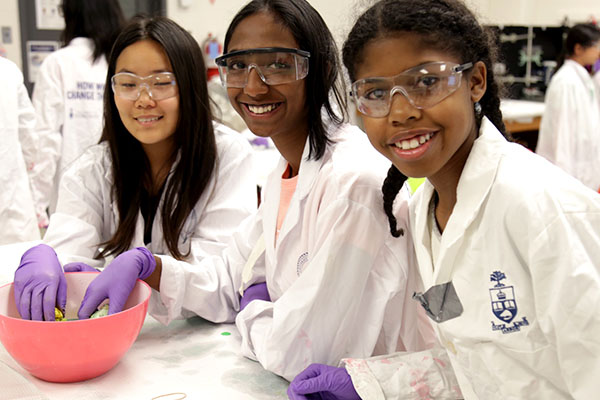
| 3.9 | Pre-University Outreach Programs, 2025–2026 | Information provided by the Engineering Student Outreach Office, Faculty of Applied Science & Engineering. |
| 3.10 | Total Number of Faculty by Academic Area, 2016–2017 to 2025–2026 | All data from U of T’s HRIS (Human Resources Information System). Women academic staff include all ranks of professors in both the tenure and teaching streams. |
| 3.11 | Total Number of Faculty with Percentage of Women Overall and by Academic Rank, 2016–2017 to 2025–2026 | All data from U of T’s HRIS (Human Resources Information System). Women academic staff include all ranks of professors in both the tenure and teaching streams. |
| 3.12 | Canada Research Chairs with Number and Percentage of Women Chairholders, 2017 to 2026 | Information provided by the Senior Reporting and Budget Analyst, Faculty of Applied Science & Engineering. Includes data sourced from the Vice Dean, Research Office, Faculty of Applied Science and Engineering; Office of the Vice-President, Research & Innovation; and from the Canada Research Chairs Program website. |
| 3.13 | Total Staff by Type and Gender, 2016–2017 to 2025–2026 | All data from U of T’s HRIS (Human Resources Information System). |
| 3.14 | Summary of Progress Against the Recommendations of the Blueprint for Action (2018), as prepared by the Eagles’ Longhouse (Engineering Indigenous Initiatives Steering Committee), 2025 | Information provided by the Dean’s Advisor on Indigenous Initiatives and the Inclusion, Diversity, and Equity Advisory (IDEA) Committee. |
| 3.15 | Summary of Progress against the Recommendations of the Final Report (2019) of the Joint Task Force on Academic Advising and Mental Health, 2025 | Information provided by the U of T Engineering Student & Community Wellness Coordinator. |
| 3.16 | Summary of Progress Against the Recommendations of Striving Toward Black Inclusivity (2019) as prepared by the Black Inclusion Steering Committee (BISC), 2024 | Information provided by the Dean’s Advisor on Black Inclusivity Initiatives and the Inclusion, Diversity, and Equity Advisory (IDEA) Committee. |
Chapter 4: Research
| 4.1a | Total Research Funding (Infrastructure + Operating), 2015–2016 to 2024–2025 | Data from the Research and Innovation Dashboards is current as of May 2026 and organized by grant year (e.g., 2024–2025 = April 2024 to March 2025 = Grant Year 2025). Infrastructure Funding includes the following programs: Canada Foundation for Innovation (except the CFI Career Award), the Ontario Innovation Trust, the Ontario Research Fund (ORF) – Research Infrastructure, and the NSERC Research Tools and Instruments (RTI) Program. |
| 4.1b | Total Research Funding (Infrastructure + Operating) by Year, Source and Funding per Faculty Member, 2015–2016 to 2024–2025 | Data from the Research and Innovation Dashboards is current as of May 2026 and adjusted to reflect each PI’s department of budgetary appointment. Organized by grant year (e.g., 2024–2025 = April 2024 to March 2025 = Grant Year 2025). Faculty data is from U of T’s HRIS (Human Resources Information System) and includes tenured and tenure-stream faculty only. |
| 4.1c | Research Operating Funding by Year, Source and Funding per Faculty Member, 2015–2016 to 2024–2025 | Data from the Research and Innovation Dashboards is current as of May 2026 and organized by grant year (e.g., 2024–2025 = April 2024 to March 2025 = Grant Year 2025). Research Operating Funding excludes the following infrastructure programs: Canada Foundation for Innovation (except the CFI Career Award), the Ontario Innovation Trust, the Ontario Research Fund (ORF) – Research Infrastructure, and the NSERC Research Tools and Instruments (RTI) Program. Faculty data is from U of T’s HRIS (Human Resources Information System) and includes tenured and tenure-stream faculty only. |
| 4.2a to 4.2h | Research Operating Funding by Academic Area - Including Year, Source and Funding per Faculty Member, 2015–2016 to 2024–2025 | Data from the Research and Innovation Dashboards is current as of May 2026 and adjusted to reflect each PI’s department of budgetary appointment. Organized by grant year (e.g., 2024–2025 = April 2024 to March 2025 = Grant Year 2025). Research Operating Funding excludes the following infrastructure programs: Canada Foundation for Innovation (except the CFI Career Award), the Ontario Innovation Trust, the Ontario Research Fund (ORF) – Research Infrastructure and the NSERC Research Tools and Instruments (RTI) Program. Faculty data is from U of T’s HRIS (Human Resources Information System) and includes tenured and tenure-stream faculty only. |
| 4.3 | Distribution of Research Operating Funding by Academic Area, 2015–2016 to 2024–2025 | Data from the Research and Innovation Dashboards is current as of May 2026 and adjusted to reflect each PI’s department of budgetary appointment. Organized by grant year (e.g., 2024–2025 = April 2024 to March 2025 = Grant Year 2025). Research Operating Funding excludes the following infrastructure programs: Canada Foundation for Innovation (except the CFI Career Award), the Ontario Innovation Trust, the Ontario Research Fund (ORF) – Research Infrastructure and the NSERC Research Tools and Instruments (RTI) Program. |
| 4.4a | Tri-Agency and NCE Support: CIHR, NSERC and NCE Funding, 2015–2016 to 2024–2025 | Data from the Research and Innovation Dashboards is current as of May 2026 and organized by grant year (e.g., 2024–2025 = April 2024 to March 2025 = Grant Year 2025). |
| 4.4b | NSERC Funding, 2024–2025 | Data from the Research and Innovation Dashboards is current as of May 2026 and organized by grant year (e.g., 2024–2025 = April 2024 to March 2025 = Grant Year 2025). Sponsor = Natural Sciences & Engineering. Grant Year = 2025. |
| 4.4c | NSERC Industrial Partnership Funding by Program, 2015–2016 to 2024–2025 | Data from the Research and Innovation Dashboards is current as of May 2026 and organized by grant year (e.g., 2024–2025 = April 2024 to March 2025 = Grant Year 2025). Sponsor = Natural Sciences & Engineering / Research Partnerships Programs |
| 4.4d | Industrial Partnerships as Proportion of Total NSERC Funding, 2015–2016 to 2024–2025 | Data from the Research and Innovation Dashboards is current as of May 2026 and organized by grant year (e.g., 2024–2025 = April 2024 to March 2025 = Grant Year 2025). Sponsor = Natural Sciences & Engineering. |
| 4.4e | NSERC Research Grant Funding by Program, 2015–2016 to 2024–2025 | Data from the Research and Innovation Dashboards is current as of May 2026 and organized by grant year (e.g., 2024–2025 = April 2024 to March 2025 = Grant Year 2025). Sponsor = Natural Sciences & Engineering. |
| 4.5a | Industry Research Funding by Academic Area, 2015–2016 to 2024–2025 | Data from the Research and Innovation Dashboards is current as of May 2026 and organized by grant year (e.g., 2024–2025 = April 2024 to March 2025 = Grant Year 2025). Industry = Corporate. |
| 4.5b | Industry Partnerships, 2025–2026 | Data from the Research and Innovation Dashboards is current as of May 2026. Industry = Corporate. Additional information gathered from selected websites (e.g. those of Industrial Research Chairs and major research consortia) and provided by individual departments within the Faculty of Applied Science & Engineering. |
| 4.6a | U of T Engineering Invention Disclosures by Academic Area, 2021–2022 to 2025–2026 | Data from the Research and Innovation Dashboards, provided by the Office of the Vice President, Research and Innovation. Data current as of May 1, 2026. |
| 4.6b | Patent Applications by Faculty, 2025–2026 | Data from the Research and Innovation Dashboards, provided by the Office of the Vice President, Research and Innovation. Data current as of May 1, 2026. |
| 4.7 | Spinoff Companies, 2006 to 2026 | Data from the Research and Innovation Dashboards, provided by the Office of the Vice President, Research and Innovation. Data current as of May 1, 2026. |
| 4.8 | Chairs and Professorships, 2025–2026 | Chairholders are reported as of the HR turnover date at the end of the reporting cycle, in this case, June 30, 2026, except in cases where new allocations (e.g. CRCs) have not yet been made public. List compiled from the following sources: • Canada Research Chairs website • Faculty Trust and Restricted Fund Accountant (Endowed Chairs) • Office of the Vice-Dean, Research, Faculty of Applied Science & Engineering • Chief Administrative Officer, Faculty of Applied Science & Engineering • Distinguished Professors and University Professors from the Office of the Vice-President & Provost website |
Chapter 5: Awards & Rankings
| 5.1 | Summary of University of Toronto Engineering Performance in World Rankings, 2025–2026 | Compiled from other figures in this chapter. |
| 5.2a | QS World University Rankings: Top 50 World Universities for Engineering & Technology, 2026 | Data from QS World University Ranking website |
| 5.2b | QS World University Rankings: Top North American Public Universities for Engineering & Technology, 2026 | Data from QS World University Ranking website |
| 5.2c | QS World University Rankings: Canadian U15 in Top 200, 2026 | Data from QS World University Ranking website |
| 5.2d | QS World University Rankings: Canadian Universities in QS by Subject, 2026 | Data from QS World University Ranking website |
| 5.3a | THE World University Ranking: Top 50 Universities for Engineering, 2026 | Data from THE World University Ranking website |
| 5.3b | THE World University Ranking: Top North American Public Universities for Engineering, 2026 | Data from THE World University Ranking website |
| 5.3c | World University Ranking: Canadian U15 in THE Top 200 for Engineering, 2026 | Data from THE World University Ranking website |
| 5.4 | Canadian Universities in the Top 200 of the Academic Ranking of World Universities (ARWU) by Subject, 2025 | Data from ARWU website |
| 5.5a | Number of Engineering Publications Indexed by Thomson Reuters for Association of American Universities (AAU) Public and Canadian Peer Institutions, 2020 to 2024 | Data from Thomson Reuters InCites™ covering 2020 to 2024. Includes public peer institutions in Canada (U15) and U.S. (AAU plus University of California at San Francisco). Schema = Essential Science Indicators (Engineering, Materials Science). |
| 5.5b | Summary of U15 Bibliometrics for Publications (Thomson Reuters/AAU, 2020 to 2024) | Data from Thomson Reuters InCites™ covering 2020 to 2024. Includes public peer institutions in Canada (U15) and U.S. (AAU plus University of California at San Francisco). Schema = Essential Science Indicators (Engineering, Materials Science). Faculty counts for analysis of U15 citations per faculty member are from the Engineers Canada 2023 Resources Report. |
| 5.5c | Number of Engineering Citations Indexed by Thomson Reuters for Association of American Universities (AAU) Public and Canadian Peer Institutions, 2020 to 2024 | Data from Thomson Reuters InCites™ covering 2020 to 2024. Includes public peer institutions in Canada (U15) and U.S. (AAU plus University of California at San Francisco). Schema = Essential Science Indicators (Engineering, Materials Science). |
| 5.5d | Summary of U15 Bibliometrics for Citations (Thomson Reuters/AAU, 2020 to 2024) | Data from Thomson Reuters InCites™ covering 2020 to 2024. Includes public peer institutions in Canada (U15) and U.S. (AAU plus University of California at San Francisco). Schema = Essential Science Indicators (Engineering, Materials Science). Faculty counts for analysis of U15 citations per faculty member are from the Engineers Canada 2023 Resources Report. |
| 5.6 | Summary of Major International, National and Provincial Awards and Honours, 2016 to 2025 | Information provided by the Director, Awards and Honours, Faculty of Applied Science & Engineering. |
| 5.7a | Number of Major National and International Awards Received by U of T Engineering Compared to Other Canadian Engineering Faculties, 2025 | Information provided by the Director, Awards and Honours, Faculty of Applied Science & Engineering. |
| 5.7b | Percentage of Engineering Faculty and Total Major Awards Received in Canadian Engineering Faculties, 2025 | Information provided by the Director, Awards and Honours, Faculty of Applied Science & Engineering. Faculty FTEs are based on the Engineering Deans Canada (EDC) 2023 Resources Report prepared by Engineers Canada and circulated to Canadian engineering deans in May 2024. |
| 5.8 | Number of Awards Received by U of T Engineering Faculty Compared to Other Canadian Engineering Faculties, 2021 to 2025 | Information provided by the Director, Awards and Honours, Faculty of Applied Science & Engineering. |
| 5.9 | Selected Awards Received by Faculty, 2025–2026 | Information provided by the Director, Awards and Honours, Faculty of Applied Science & Engineering. |
| 5.10a | 2026 U of T Engineering Staff and Faculty Awards | Information provided by the Director, Awards and Honours, Faculty of Applied Science & Engineering. |
| 5.10b | 2025 Engineering Alumni Network Awards | Information provided by the Office of Advancement and Alumni Relations, Faculty of Applied Science & Engineering. |
Chapter 6: Advancement and Communications
| 6.1a | Philanthropic Support, 2025–2026 | Statistics provided by the Office of Advancement and Alumni Relations, Faculty of Applied Science & Engineering. |
| 6.1b | Philanthropic Support, 2016–2017 to 2025–2026 | Statistics provided by the Office of Advancement and Alumni Relations, Faculty of Applied Science & Engineering. |
| 6.1c | Gift Designations, 2025–2026 | Statistics provided by the Office of Advancement and Alumni Relations, Faculty of Applied Science & Engineering. |
| 6.1d | Alumni Engagement, 2025–2026 | Statistics provided by the Office of Advancement and Alumni Relations, Faculty of Applied Science & Engineering. |
| 6.2a | U of T Engineering Media Stories and Impressions, 2025–2026 | Information provided by Engineering Strategic Communications, Faculty of Applied Science & Engineering. |
| 6.2b | Proportion of U of T Engineering Media Impressions by Academic Area, 2025–2026 | Information provided by Engineering Strategic Communications, Faculty of Applied Science & Engineering. |
| 6.2c | Proportion of U of T Engineering Media Impressions by Strategic Priority Area, 2025–2026 | Information provided by Engineering Strategic Communications, Faculty of Applied Science & Engineering. |
| 6.2d | Proportion of U of T Engineering Media Impressions by Outlet Location, 2025–2026 | Information provided by Engineering Strategic Communications, Faculty of Applied Science & Engineering. |
| 6.3a | Facebook Statistics, 2025–2026 | Information provided by Engineering Strategic Communications, Faculty of Applied Science & Engineering. |
| 6.3b | Instagram Statistics, 2025–2026 | Information provided by Engineering Strategic Communications, Faculty of Applied Science & Engineering. |
| 6.3c | LinkedIn Statistics, 2025–2026 | Information provided by Engineering Strategic Communications, Faculty of Applied Science & Engineering. |
| 6.4 | Summary of Analytics for U of T Engineering Faculty Site and U of T Engineering News Site, 2025–2026 | Websites: engineering.utoronto.ca and news.engineering.utoronto.ca. Information provided by Engineering Strategic Communications, Faculty of Applied Science & Engineering. Website statistics sourced from Google Analytics (May 1, 2025 to April 30, 2026) |
| 6.5 | Social Media Referrals for U of T Engineering News, 2025–2026 | Information provided by Engineering Strategic Communications, Faculty of Applied Science & Engineering. Website statistics sourced from Google Analytics (May 1, 2025 to April 30, 2026) |
| 6.6 | Summary of Analytics for Discover Engineering, Welcome to Skule™ and Engineering Graduate Studies sites, 2025–2026 | Websites: discover.engineering.utoronto.ca, welcome.engineering.utoronto.ca and gradstudies.engineering.utoronto.ca. Website statistics sourced from Google Analytics (May 1, 2025 to April 30, 2026) |
| 6.7 | Top 25 Stories on the Engineering News and U of T News Websites, 2025–2026 | Information provided by Engineering Strategic Communications, Faculty of Applied Science & Engineering and University of Toronto Strategic Communications. Website statistics sourced from Google Analytics (May 1, 2025 to April 30, 2026) |
Chapter 7: Financial and Physical Resources
| 7.1 | Total Revenue, 2016–2017 to 2025–2026 | Information provided by the Chief Financial Officer, Faculty of Applied Science & Engineering. |
| 7.2 | Total Central Costs, 2016–2017 to 2025–2026 | Information provided by the Chief Financial Officer, Faculty of Applied Science & Engineering. |
| 7.3 | Budget Data, 2016–2017 to 2025–2026 | Information provided by the Chief Financial Officer, Faculty of Applied Science & Engineering. |
| 7.4 | Revenue Sources, 2025–2026 | Information provided by the Chief Financial Officer, Faculty of Applied Science & Engineering. |
| 7.5 | Revenue Distribution, 2025–2026 | Information provided by the Chief Financial Officer, Faculty of Applied Science & Engineering. |
| 7.6 | Total Operating Budget: Breakdown by Expenses (Net of Central University Costs), 2025–2026 | Information provided by the Chief Financial Officer, Faculty of Applied Science & Engineering. |
| 7.7 | Summary of Buildings Occupied by Engineering, 2025–2026 | Data is from Archibus, the U of T campus space database maintained by University Planning, Design & Construction. Space Manager Report: Campus Building Detail by Room Number. Division Code for the Faculty of Applied Science and Engineering = 500 |
| 7.8 | Selected Infrastructure Investments, 2025–2026 | Data provided by the Director, Facilities & Infrastructure Planning, Faculty of Applied Science & Engineering. |
| 7.9 | The Engineering Neighbourhood | Information from the Office of Space Management. Visit map.utoronto.ca for a full campus map. |