By the Numbers 2024
Explore comprehensive visual data about the Faculty in this companion piece to our 2024 Impact Report
Chapter 3: Inclusive Community
Data in this chapter are presented by academic year (September to August) unless otherwise noted.
Facts & Figures
37.1%
Proportion of women across all programs, including 39.1% of undergraduate students and 33.0% of graduate students
54.3%
Proportion of U of T Engineering Canada Research Chair holders who are women
100+
Number of undergraduate and graduate student clubs and teams, from the Skule™ Orchestra to our Formula SAE team
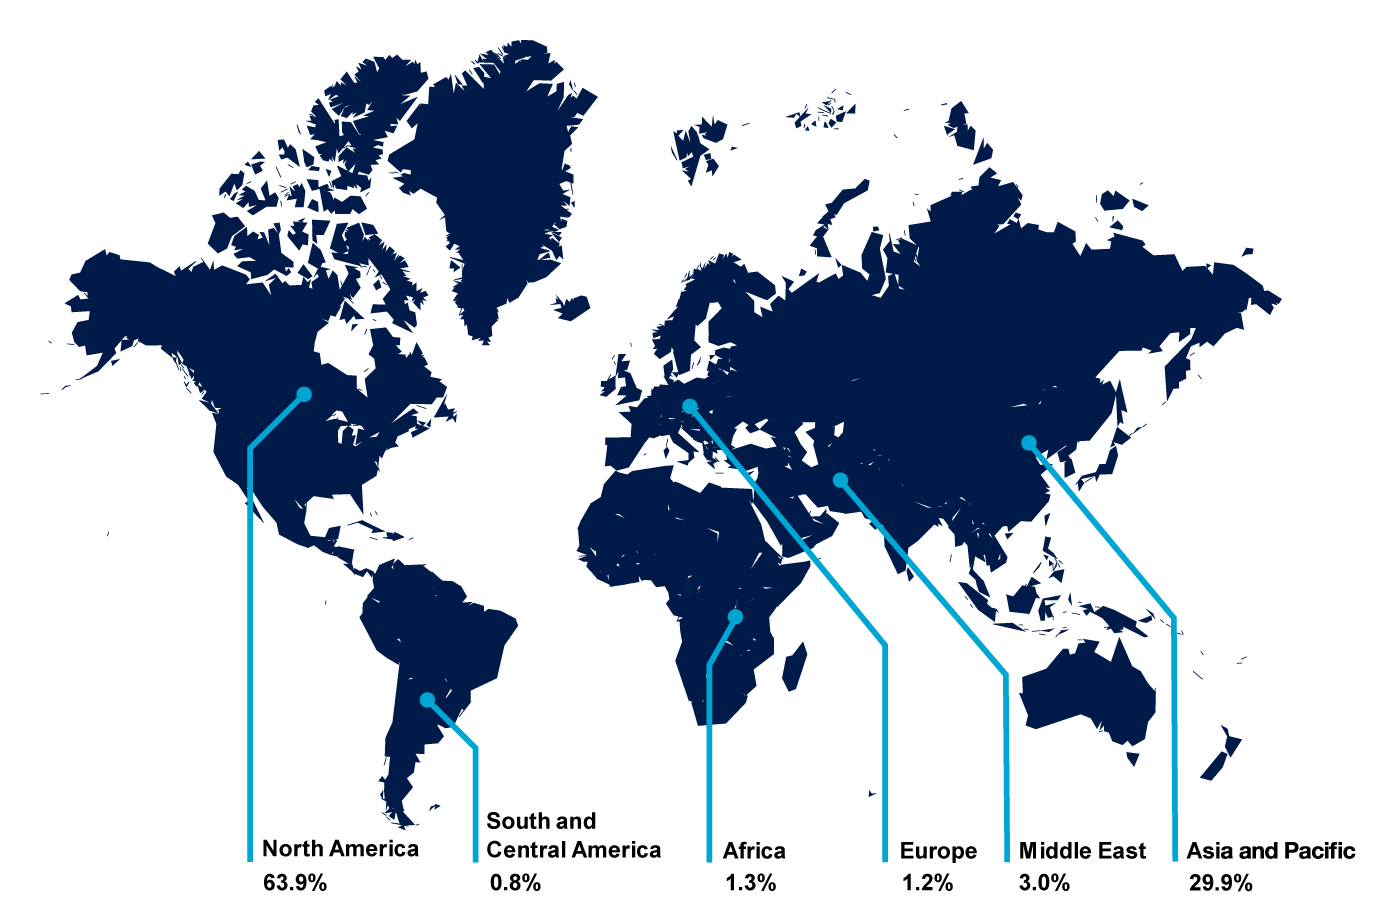
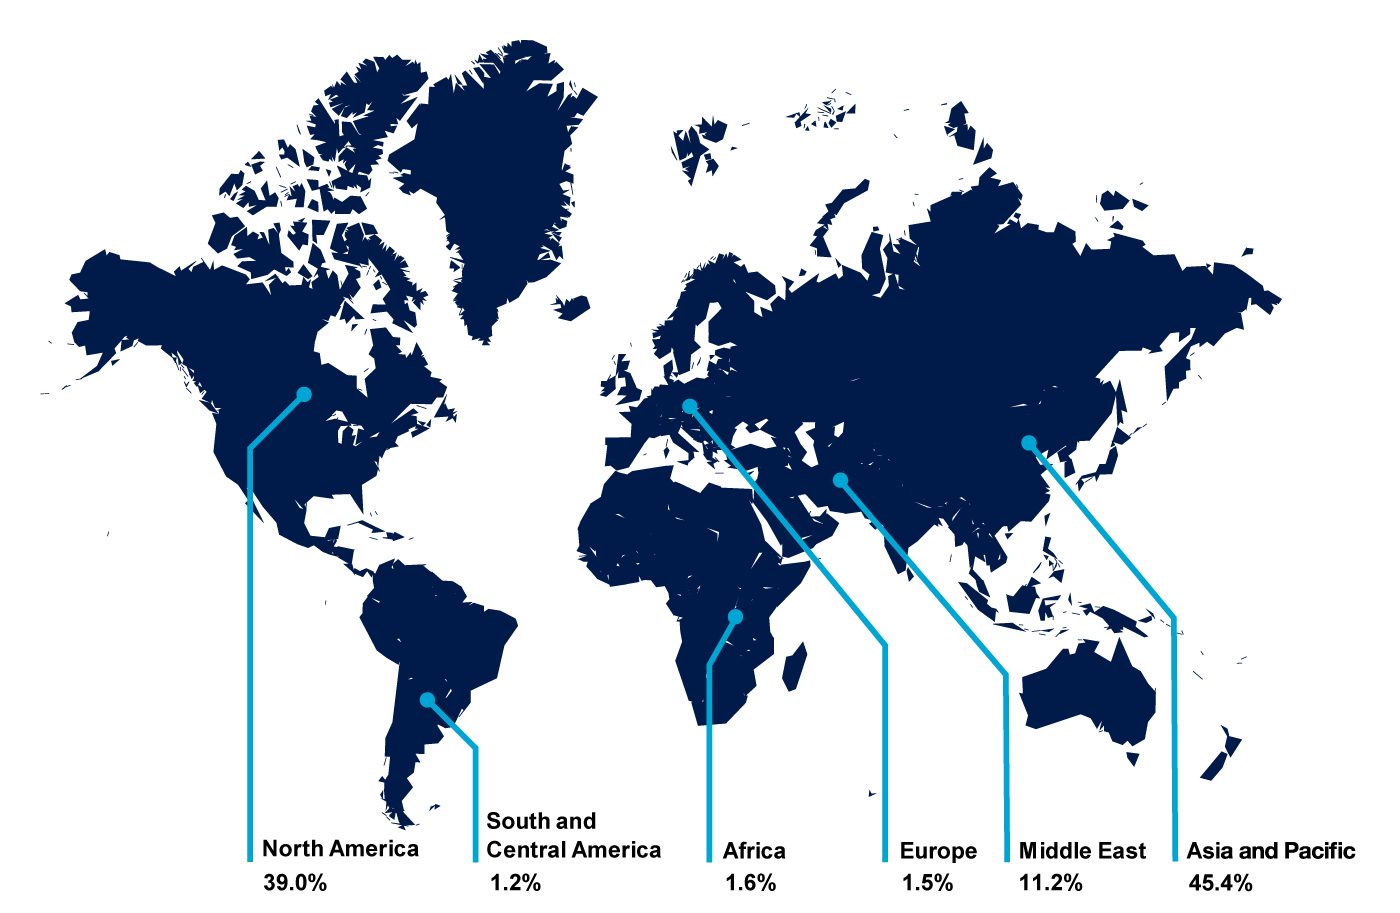
Figure 3.1 Continent of Origin: Undergraduate Students, Fall 2023–2024
Proportions are as of November 1, 2023. Country of origin is based on citizenship, and does not necessarily indicate current Canadian immigration status, which is used to determine domestic/international student status for tuition and funding purposes, as reported elsewhere in this report. Canadian permanent residents are counted as domestic students while retaining their citizenship elsewhere.
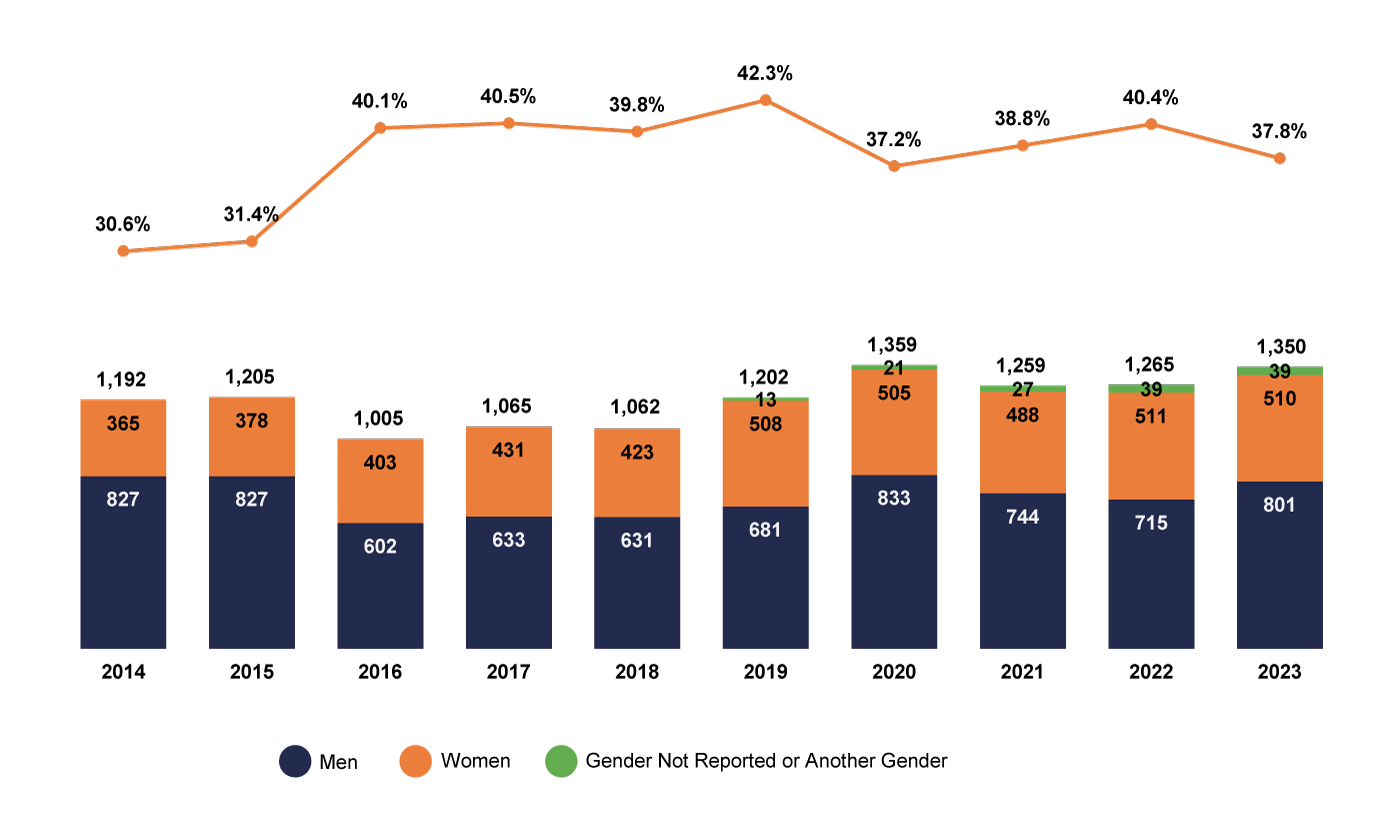
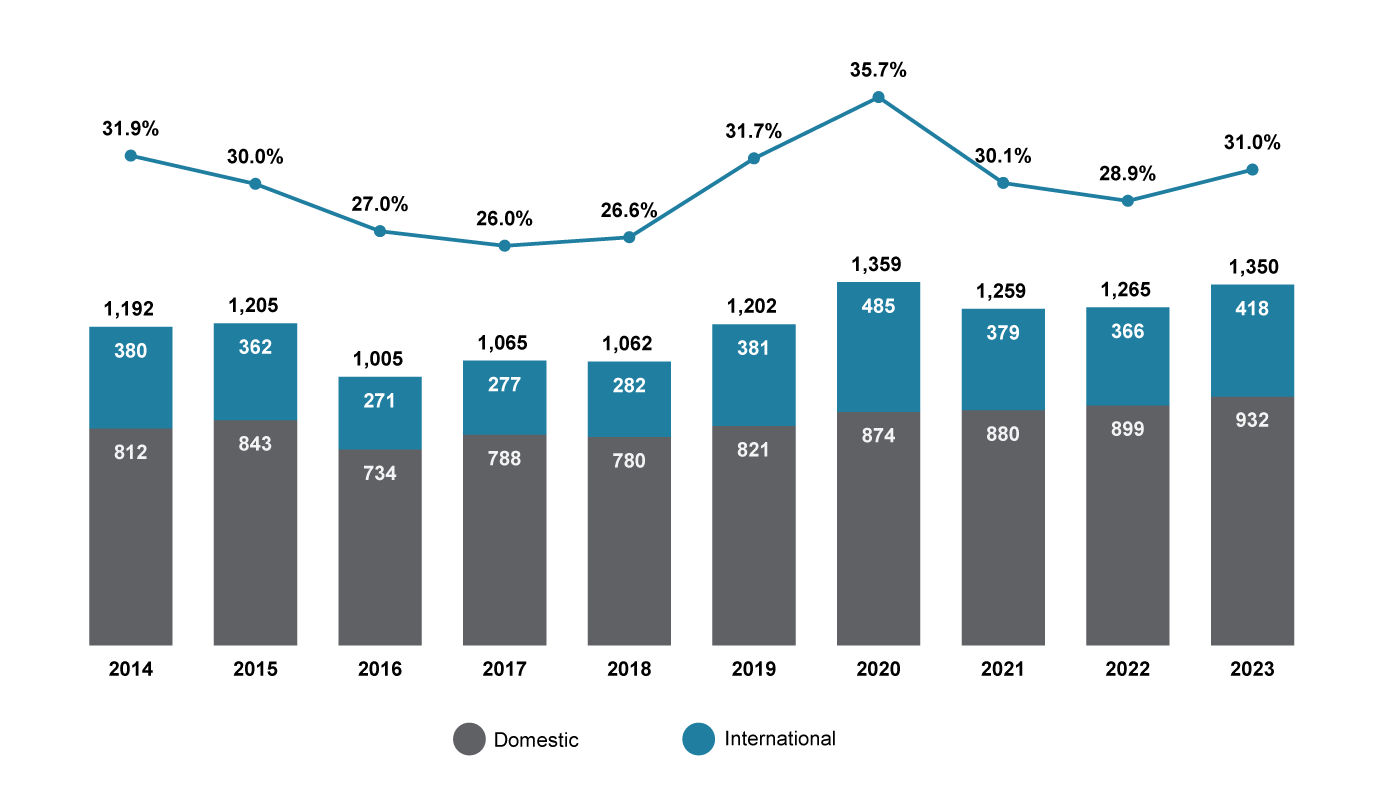
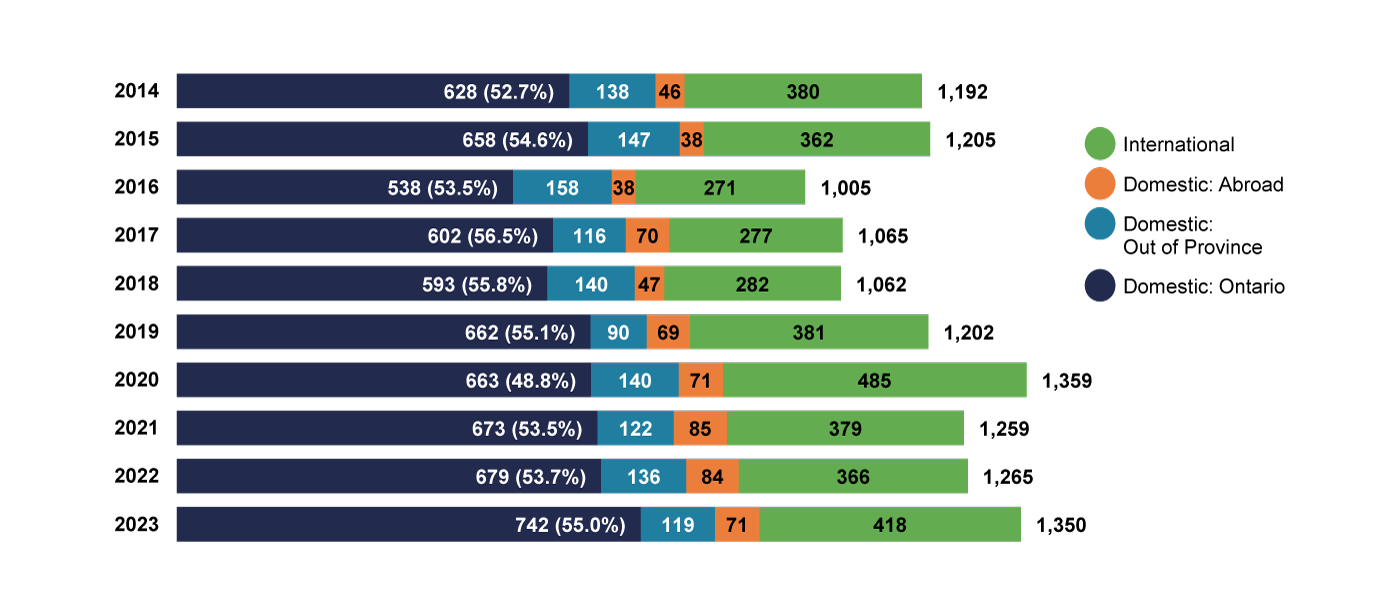
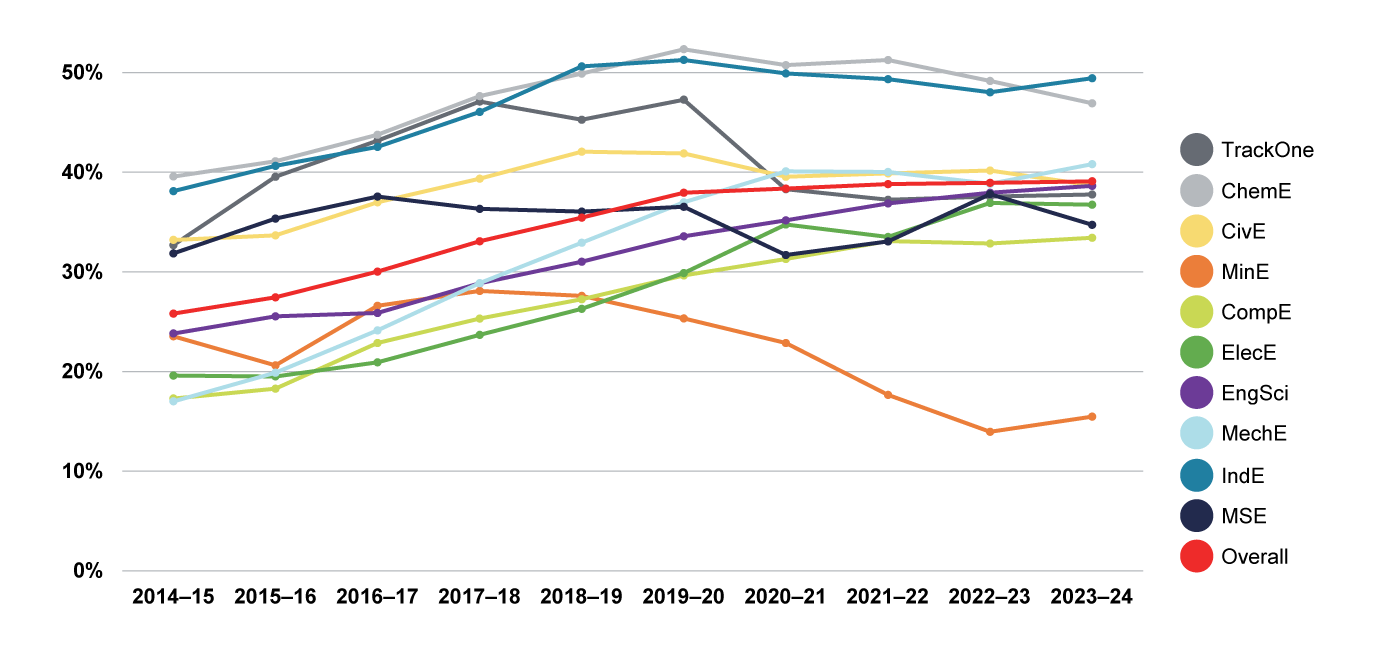
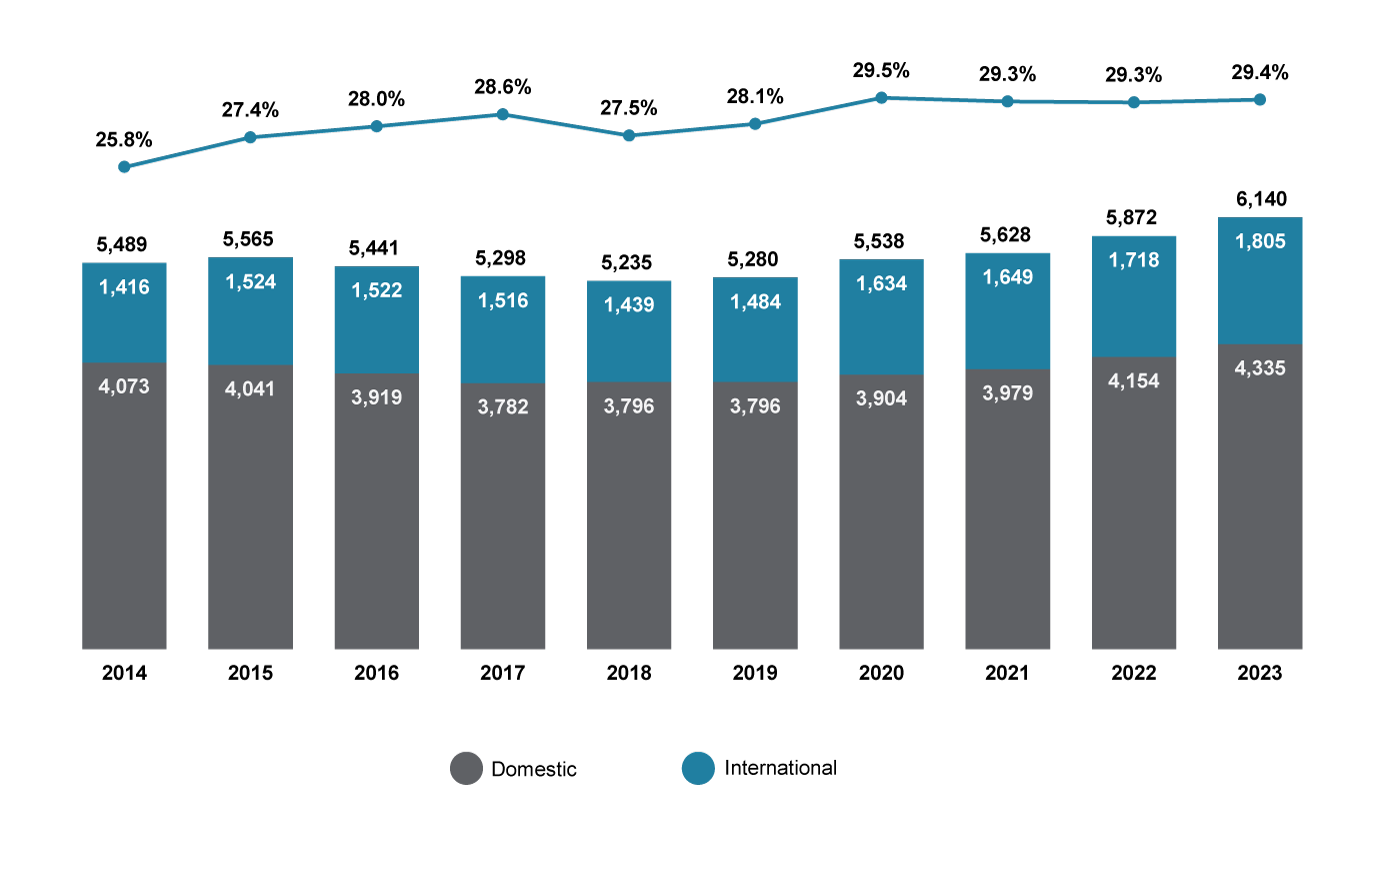
Figure 3.3a Undergraduate Enrolment with Percentage of Women, 2014–2015 to 2023–2024
Includes full- and part-time students and those working full time through the Professional Experience Year Co-op Program (PEY Co-op). Does not count students with special (non-degree) status. Student counts shown as of November 1. Domestic students are defined as citizens or permanent residents of Canada. Data on student gender comes from the U of T Historical Enrolment Count Tool; the options to report “another gender” or to not report gender were added in 2017.
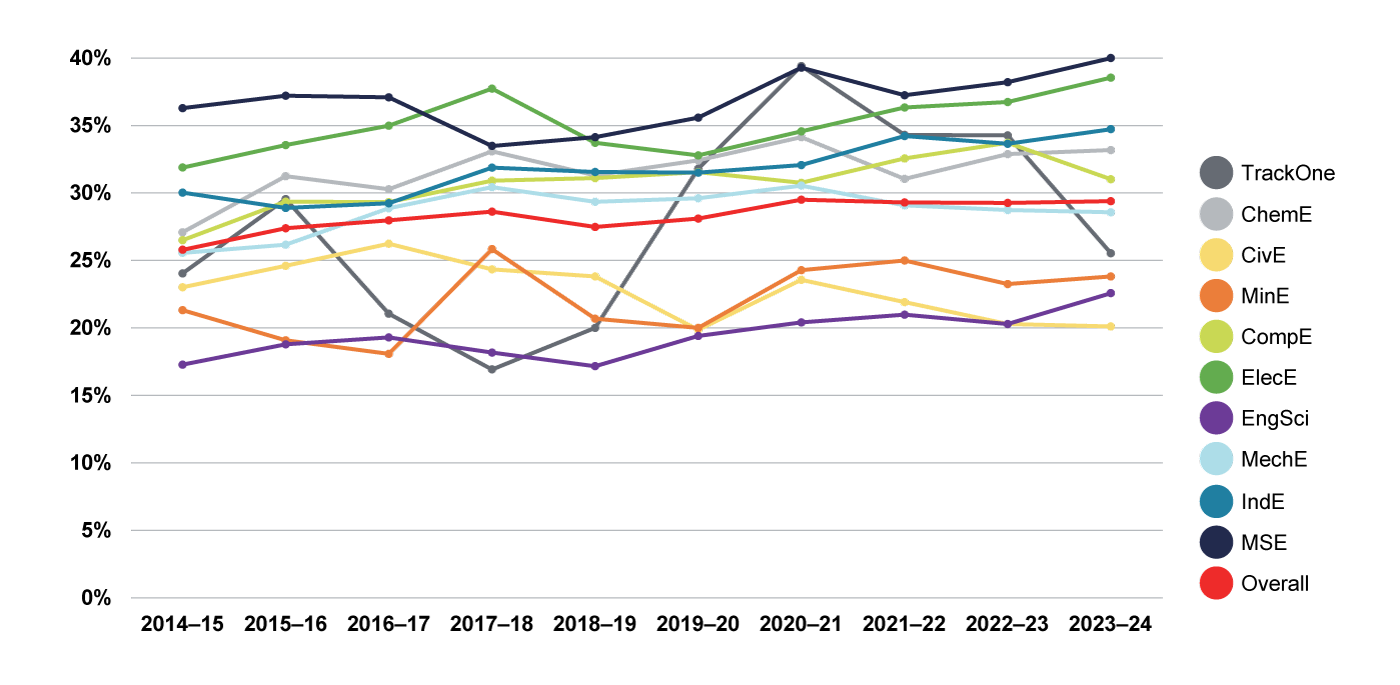
Figure 3.3b Percentage of Women by Undergraduate Program, 2014–2015 to 2023–2024
Includes full- and part-time students and those working full time through the Professional Experience Year Co-op Program (PEY Co-op). Does not count students with special (non-degree) status. Student counts shown as of November 1. Data on student gender comes from the U of T Historical Enrolment Count Tool; the options to report “another gender” or to not report gender were added in 2017.
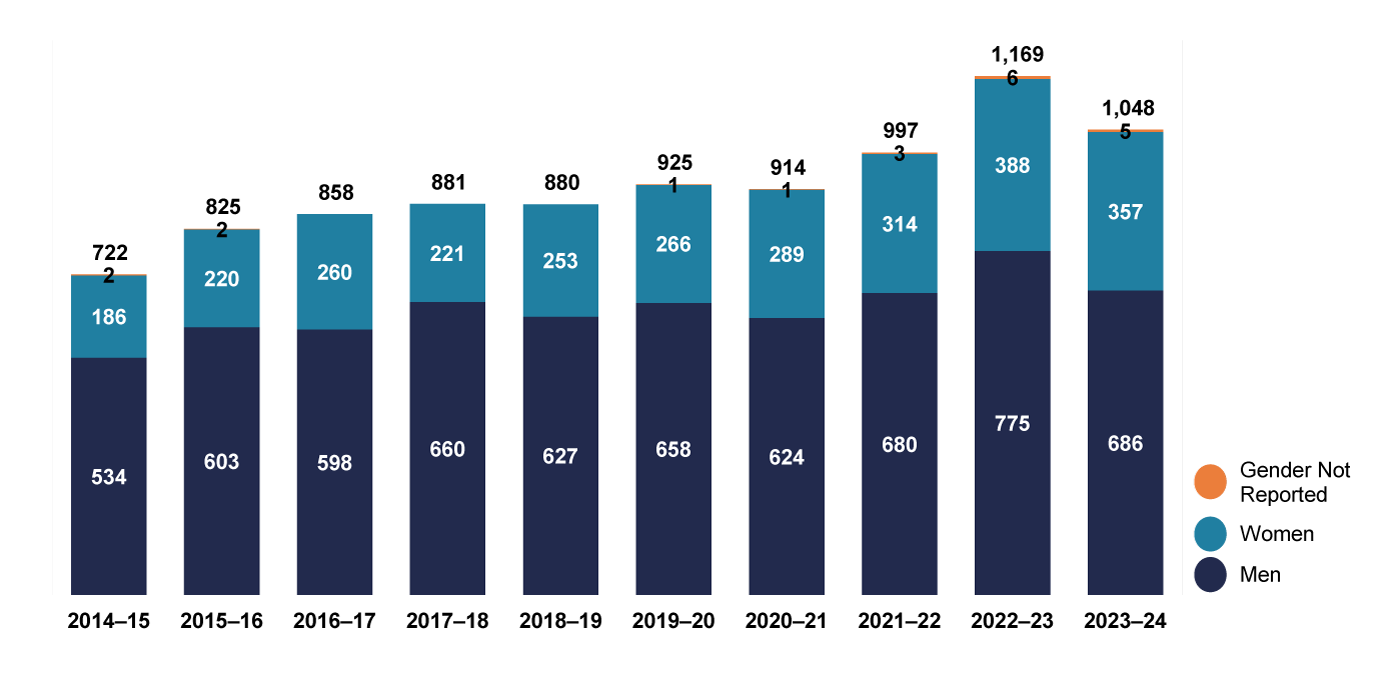
Figure 3.4 Undergraduate Degrees Awarded by Gender, 2014–2015 to 2023–2024
Data reported by academic year (September to August). Data on student gender comes from the U of T Historical Enrolment Count Tool; the options to report “another gender” or to not report gender were added in 2017.
Figure 3.5 Continent of Origin: Graduate Students, Fall 2023–2024
Proportions are as of November 1, 2023. Country of origin is based on citizenship, and does not necessarily indicate current Canadian immigration status, which is used to determine domestic/international student status for tuition and funding purposes, as reported elsewhere in this report. Canadian permanent residents are counted as domestic students while retaining their citizenship elsewhere.
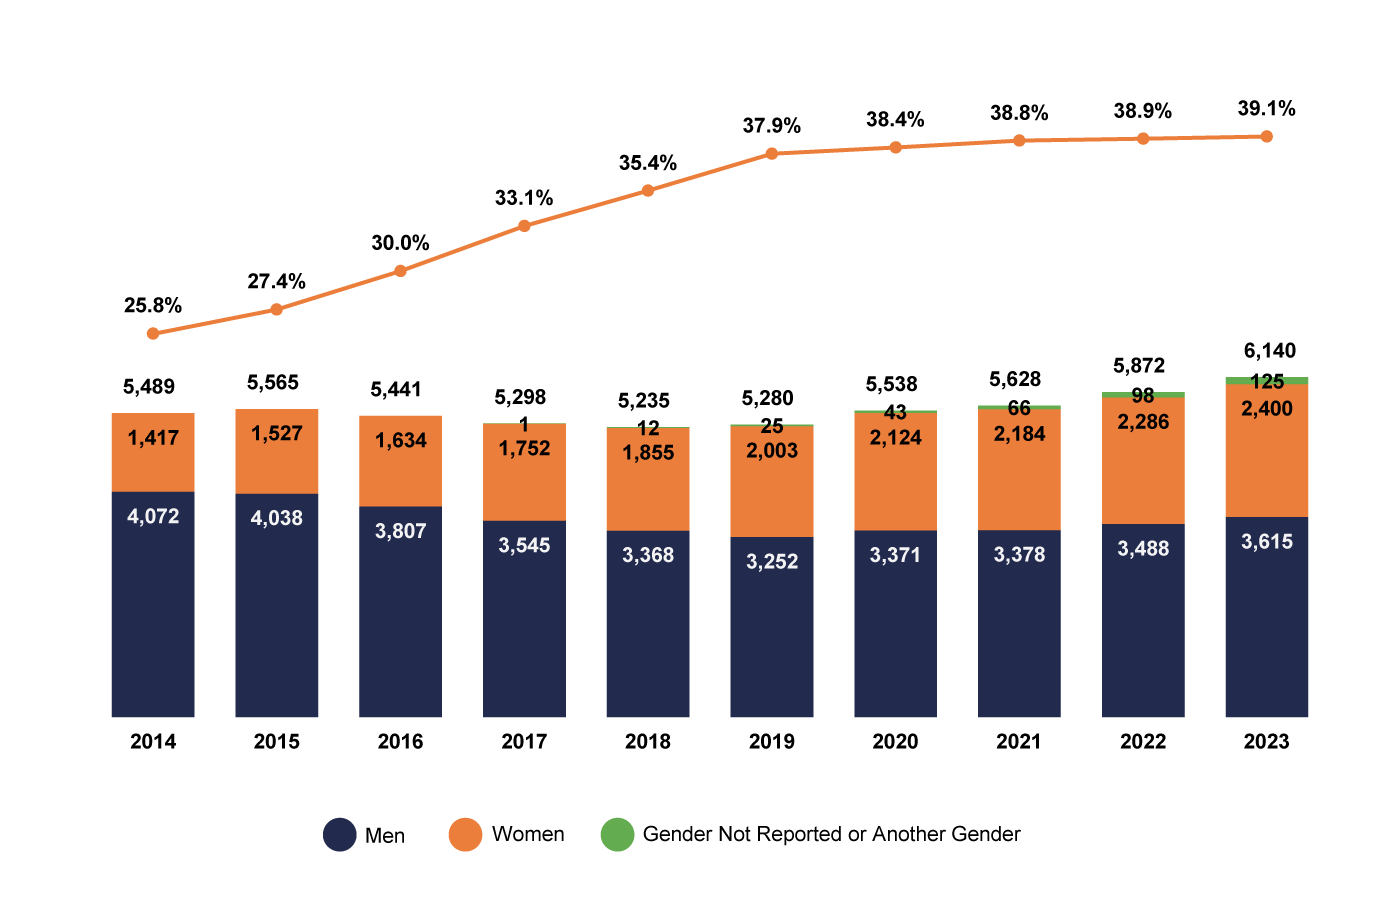
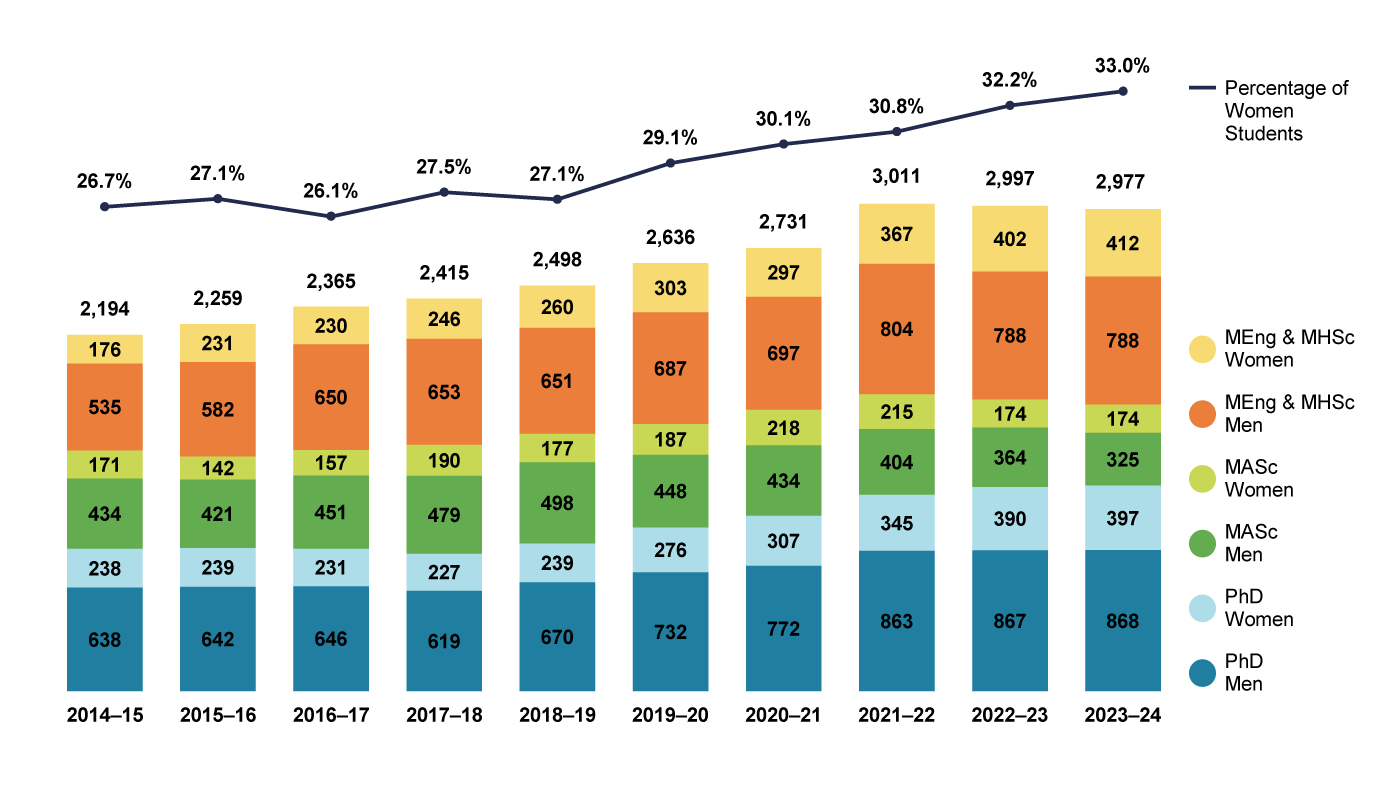
Figure 3.6a Graduate Students by Degree Type and Gender with Percentage of Women, 2014–2015 to 2023–2024
Student counts are shown as of November 1. Data on gender comes from the School of Graduate Studies’ student enrolment cube, where gender is an optional category. Students who opted not to report their gender appear in the data table, but are not visible in the graph presented above.
| Year | MEng & MHSc Women | MEng & MHSc Men | MEng & MHSc Gender Not Reported | MASc Women | MASc Men | MASc Gender Not Reported | PhD Women | PhD Men | PhD Gender Not Reported |
|---|---|---|---|---|---|---|---|---|---|
| 2014–15 | 176 | 535 | 1 | 171 | 434 | 1 | 238 | 638 | |
| 2015–16 | 231 | 582 | 2 | 142 | 421 | 239 | 642 | ||
| 2016–17 | 230 | 650 | 157 | 451 | 231 | 646 | |||
| 2017–18 | 246 | 653 | 190 | 479 | 1 | 227 | 619 | ||
| 2018–19 | 260 | 651 | 177 | 498 | 1 | 239 | 670 | 2 | |
| 2019–20 | 303 | 687 | 1 | 187 | 448 | 276 | 732 | 2 | |
| 2020–21 | 297 | 697 | 3 | 218 | 434 | 1 | 307 | 772 | 2 |
| 2021–22 | 367 | 804 | 10 | 215 | 404 | 1 | 345 | 863 | 2 |
| 2022–23 | 402 | 788 | 7 | 174 | 364 | 2 | 390 | 867 | 2 |
| 2023–24 | 412 | 788 | 5 | 174 | 325 | 2 | 397 | 868 | 1 |
Figure 3.8 Engineering Undergraduate and Graduate Clubs and Teams, 2023–2024
This list includes the 81 undergraduate and graduate student clubs and teams that shared $370,790.40 in funding through the annual Centralized Process for Student Initiative Funding (CPSIF) cycle, as well as U of T Engineering groups that got their funding from other sources, for a total of 111. Beyond the groups presented here, our students also participate in hundreds more clubs and teams across U of T.
Figure 3.9 Pre-University Outreach Programs, 2023–2024
Data cover all programs that started between June 2023 and May 2024.
| Program | Date | Audience | Female | Male | Another Gender or Gender Not Reported | Online or in person | Total # of Participants |
|---|---|---|---|---|---|---|---|
| SUMMER 2023 | |||||||
| Girls’ Jr. DEEP | Jul 3–7 | Grade 3–8, female-identifying | 57 | 0 | 0 | In person | 57 |
| Girls’ Jr. DEEP Coding | Jul 3–7 | Grade 7–8, female-identifying | 14 | 0 | 0 | In person | 14 |
| Jr. DEEP | Jul 10 – Aug 25 | Grades 3–8 | 143 | 279 | 0 | In person | 422 |
| Jr. DEEP Coding | Jul 10 – Aug 25 | Grade 7–8 | 28 | 65 | 0 | In person | 93 |
| Jr. DEEP (Markham) | Jul 10–21 | Grades 3–8 | 18 | 32 | 0 | In person | 50 |
| Revving Up Event | Jun 6 | Grades 5-8 | 2 | 13 | 0 | In person | 15 |
| 100 Strong Summer Academy | Jul 2023 | Grades 6–8, Black and male identifying | 0 | 30 | 0 | In person | 30 |
| CREATE: Engineering Design Challenges | Jul 10 – Aug 25 | Grades 9–12 | 144 | 270 | 5 | In person | 419 |
| DEEP Summer Academy | Jul 10 – Aug 4 | Grades 9–12 | 63 | 150 | 1 | In person | 214 |
| Global Engineering Challenge | Jul 15 – Aug 20 | Grades 9–12 | 7 | 26 | 0 | Virtual | 33 |
| Blueprint 2023 | Jul 4–28 | Grades 10–11, Black-identifying | 20 | 20 | 0 | In person | 40 |
| LAUNCH Science and Engineering Program | Jul 4–28 | Grades 3–5, priority neighbourhoods | 62 | 73 | 0 | In person | 135 |
| Destination STEM (High Park) | Jul 4–21 | Grades 3–8 | 2 | 23 | 0 | In person | 25 |
| Girls In Medicine | Aug 8–24 | Grades 3–5, female-identifying | 245 | 0 | 5 | Virtual | 250 |
| Girls in Engineering Day | Aug 5 | Grades 5–8 | 73 | 0 | 0 | In person | 73 |
| IDEA: Leader in Training Program (Indigenous Design and Engineering Academy) | Jul 17–28 | Grades 10–12, Indigenous students | 4 | 2 | 0 | Virtua/in person | 6 |
| IDEA: Horizons (Indigenous Design and Engineering Academy) | Aug 14–25 | Grades 4–6, Indigenous students | 8 | 9 | 4 | In person | 21 |
| FALL 2023-WINTER 2024 | |||||||
| Black Applicant Support & Engagement (BASE) | Oct 30, 2023 – Jan 16, 2024 | Grade 12, Black-identifying | 5 | 9 | 0 | Virtual | 14 |
| Blueprint: MAPS and Prepare | Oct 31, 2023 – March 13, 2024 | Grades 11–12, Black-identifying | 31 | 32 | 0 | Virtual | 63 |
| Go ENG Girl | Nov 25, 2024 | Grades 7–10, female-identifying | 100 | 0 | 1 | In person | 101 |
| SPRING 2024 | |||||||
| Go Code Girl | Mar 23 | Grades 7–10, female-identifying | 57 | 0 | 0 | In person | 57 |
| Educator Workshops: Ready, Set, CODE! Teaching the New Ontario Coding Curriculum | Mar 27 – Jun 5 | Educators | N/A | N/A | 44 | Virtual | 44 |
| CREATE Weekends | May 25 – Jun 8 | Grades 9–12 | 28 | 68 | 0 | In person | 96 |
| Total: | 1,111 | 1101 | 60 | 2,272 |
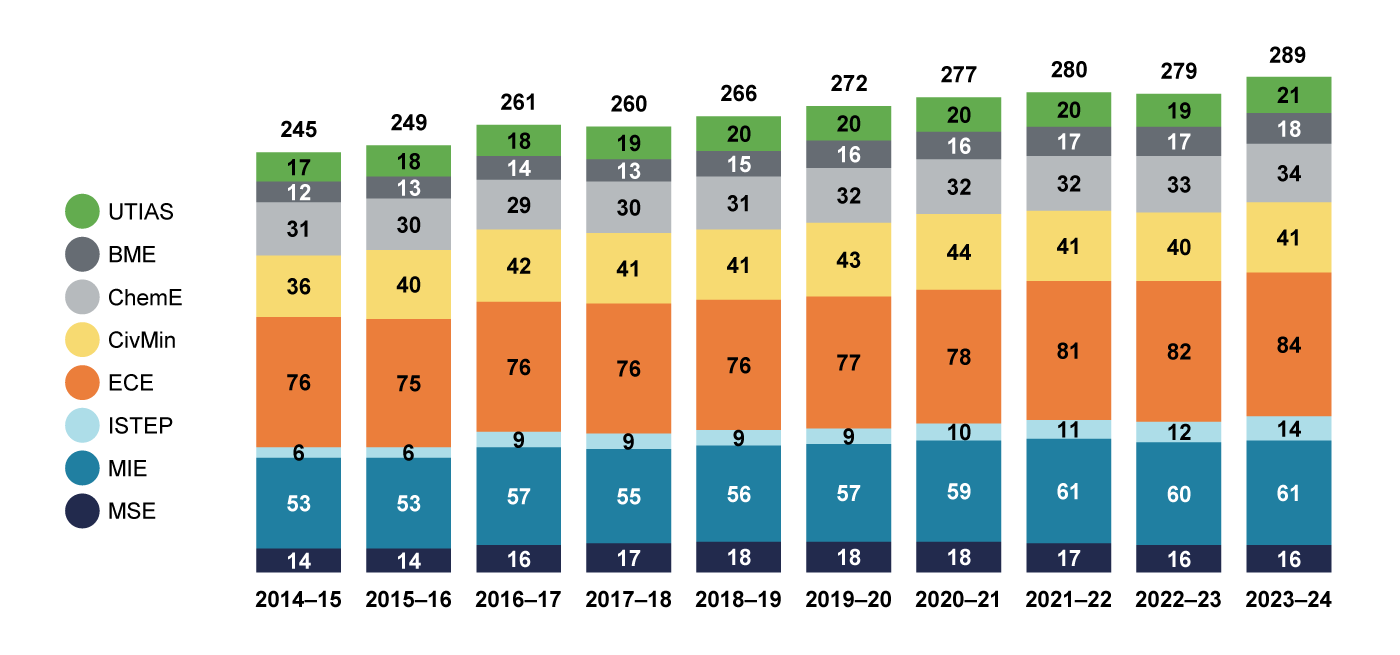
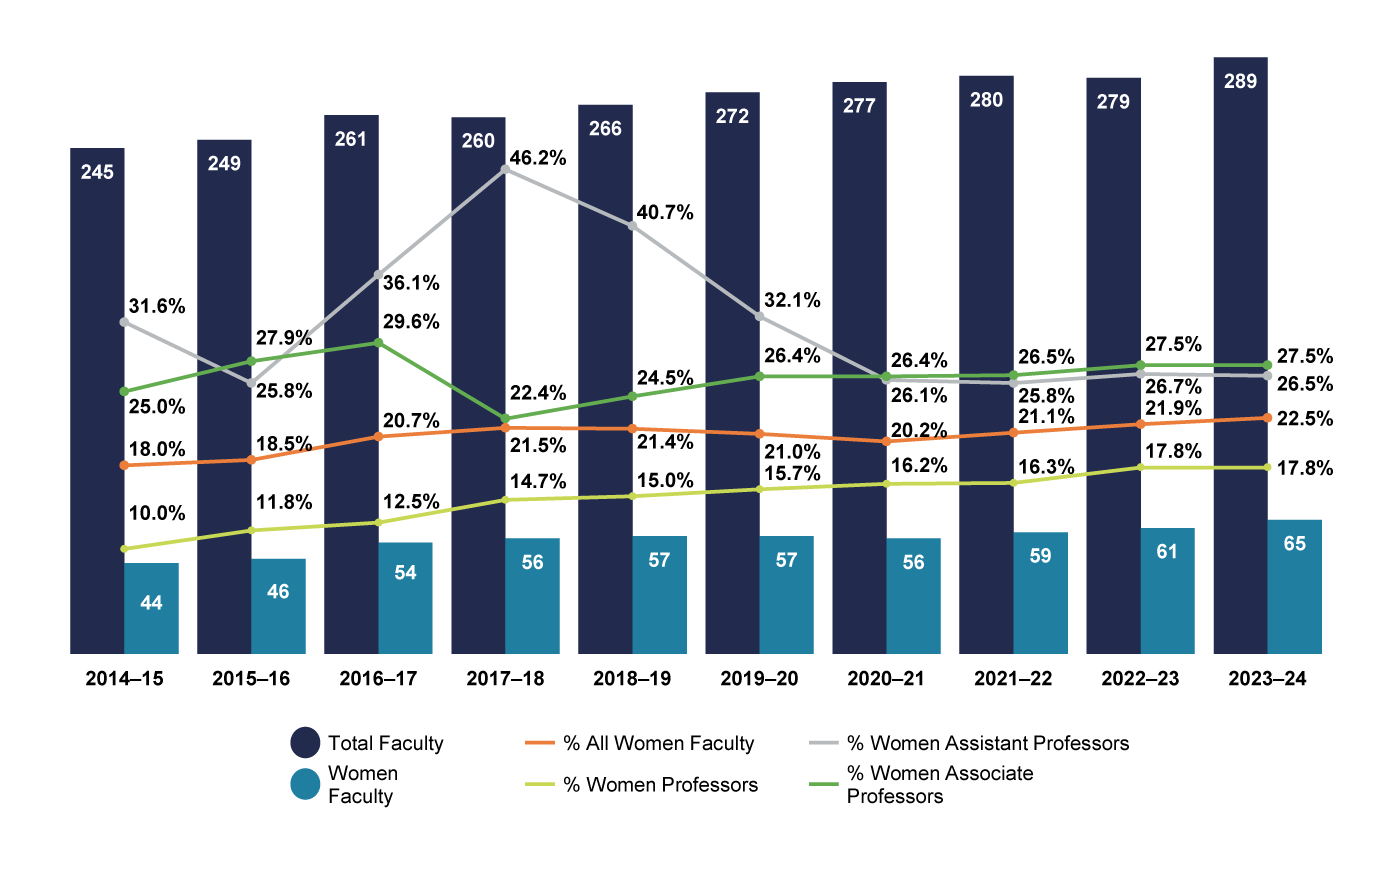
Figure 3.10 Total Number of Faculty by Academic Area, 2014–2015 to 2023–2024
Faculty counts do not include contractually limited term appointments (CLTAs).
| 2014-15 | 2015-16 | 2016-17 | 2017-18 | 2018-19 | 2019-20 | 2020-21 | 2021-22 | 2022-23 | 2023-24 | ||
|---|---|---|---|---|---|---|---|---|---|---|---|
| UTIAS | Assistant Profs | 5 | 4 | 3 | 2 | 3 | 3 | 1 | 1 | 0 | 0 |
| Associate Profs | 4 | 6 | 6 | 8 | 6 | 6 | 8 | 7 | 7 | 7 | |
| Professors | 6 | 6 | 7 | 7 | 9 | 9 | 9 | 10 | 10 | 10 | |
| Teaching-Stream Faculty | 2 | 2 | 2 | 2 | 2 | 2 | 2 | 2 | 2 | 4 | |
| BME | Assistant Profs | 4 | 4 | 4 | 2 | 3 | 3 | 3 | 4 | 4 | 5 |
| Associate Profs | 3 | 4 | 4 | 6 | 7 | 6 | 6 | 6 | 6 | 6 | |
| Professors | 4 | 4 | 4 | 3 | 3 | 5 | 5 | 5 | 5 | 5 | |
| Teaching-Stream Faculty | 1 | 1 | 2 | 2 | 2 | 2 | 2 | 2 | 2 | 2 | |
| ChemE | Assistant Profs | 5 | 4 | 4 | 3 | 3 | 1 | 1 | 2 | 3 | 4 |
| Associate Profs | 5 | 5 | 2 | 4 | 4 | 5 | 5 | 4 | 1 | 1 | |
| Professors | 17 | 17 | 20 | 20 | 21 | 23 | 23 | 23 | 26 | 26 | |
| Teaching-Stream Faculty | 4 | 4 | 3 | 3 | 3 | 3 | 3 | 3 | 3 | 3 | |
| CivMin | Assistant Profs | 8 | 5 | 8 | 6 | 7 | 8 | 6 | 9 | 6 | 7 |
| Associate Profs | 9 | 14 | 12 | 12 | 9 | 11 | 10 | 9 | 8 | 8 | |
| Professors | 18 | 20 | 21 | 22 | 24 | 23 | 27 | 23 | 26 | 26 | |
| Teaching-Stream Faculty | 1 | 1 | 1 | 1 | 1 | 1 | 1 | 0 | 0 | 0 | |
| ECE | Assistant Profs | 7 | 5 | 5 | 2 | 1 | 2 | 3 | 6 | 7 | 7 |
| Associate Profs | 16 | 16 | 15 | 13 | 12 | 11 | 10 | 10 | 7 | 7 | |
| Professors | 49 | 50 | 51 | 56 | 58 | 60 | 61 | 61 | 63 | 63 | |
| Teaching-Stream Faculty | 4 | 4 | 5 | 5 | 5 | 4 | 4 | 4 | 5 | 7 | |
| ISTEP | Assistant Profs | 0 | 0 | 0 | 0 | 0 | 0 | 0 | 0 | 1 | 2 |
| Teaching-Stream Faculty | 6 | 6 | 9 | 9 | 9 | 9 | 10 | 11 | 11 | 12 | |
| MIE | Assistant Profs | 6 | 6 | 9 | 7 | 7 | 9 | 7 | 8 | 8 | 8 |
| Associate Profs | 15 | 12 | 11 | 12 | 10 | 8 | 8 | 7 | 7 | 7 | |
| Professors | 29 | 32 | 33 | 33 | 36 | 37 | 39 | 41 | 40 | 40 | |
| Teaching-Stream Faculty | 3 | 3 | 4 | 3 | 3 | 3 | 5 | 5 | 5 | 6 | |
| MSE | Assistant Profs | 3 | 3 | 3 | 4 | 3 | 2 | 2 | 1 | 1 | 1 |
| Associate Profs | 4 | 4 | 4 | 3 | 5 | 6 | 6 | 6 | 4 | 4 | |
| Professors | 7 | 7 | 8 | 9 | 9 | 9 | 9 | 9 | 10 | 10 | |
| Teaching-Stream Faculty | 0 | 0 | 1 | 1 | 1 | 1 | 1 | 1 | 1 | 1 | |
| Total | 245 | 249 | 261 | 260 | 266 | 272 | 277 | 280 | 279 | 289 |
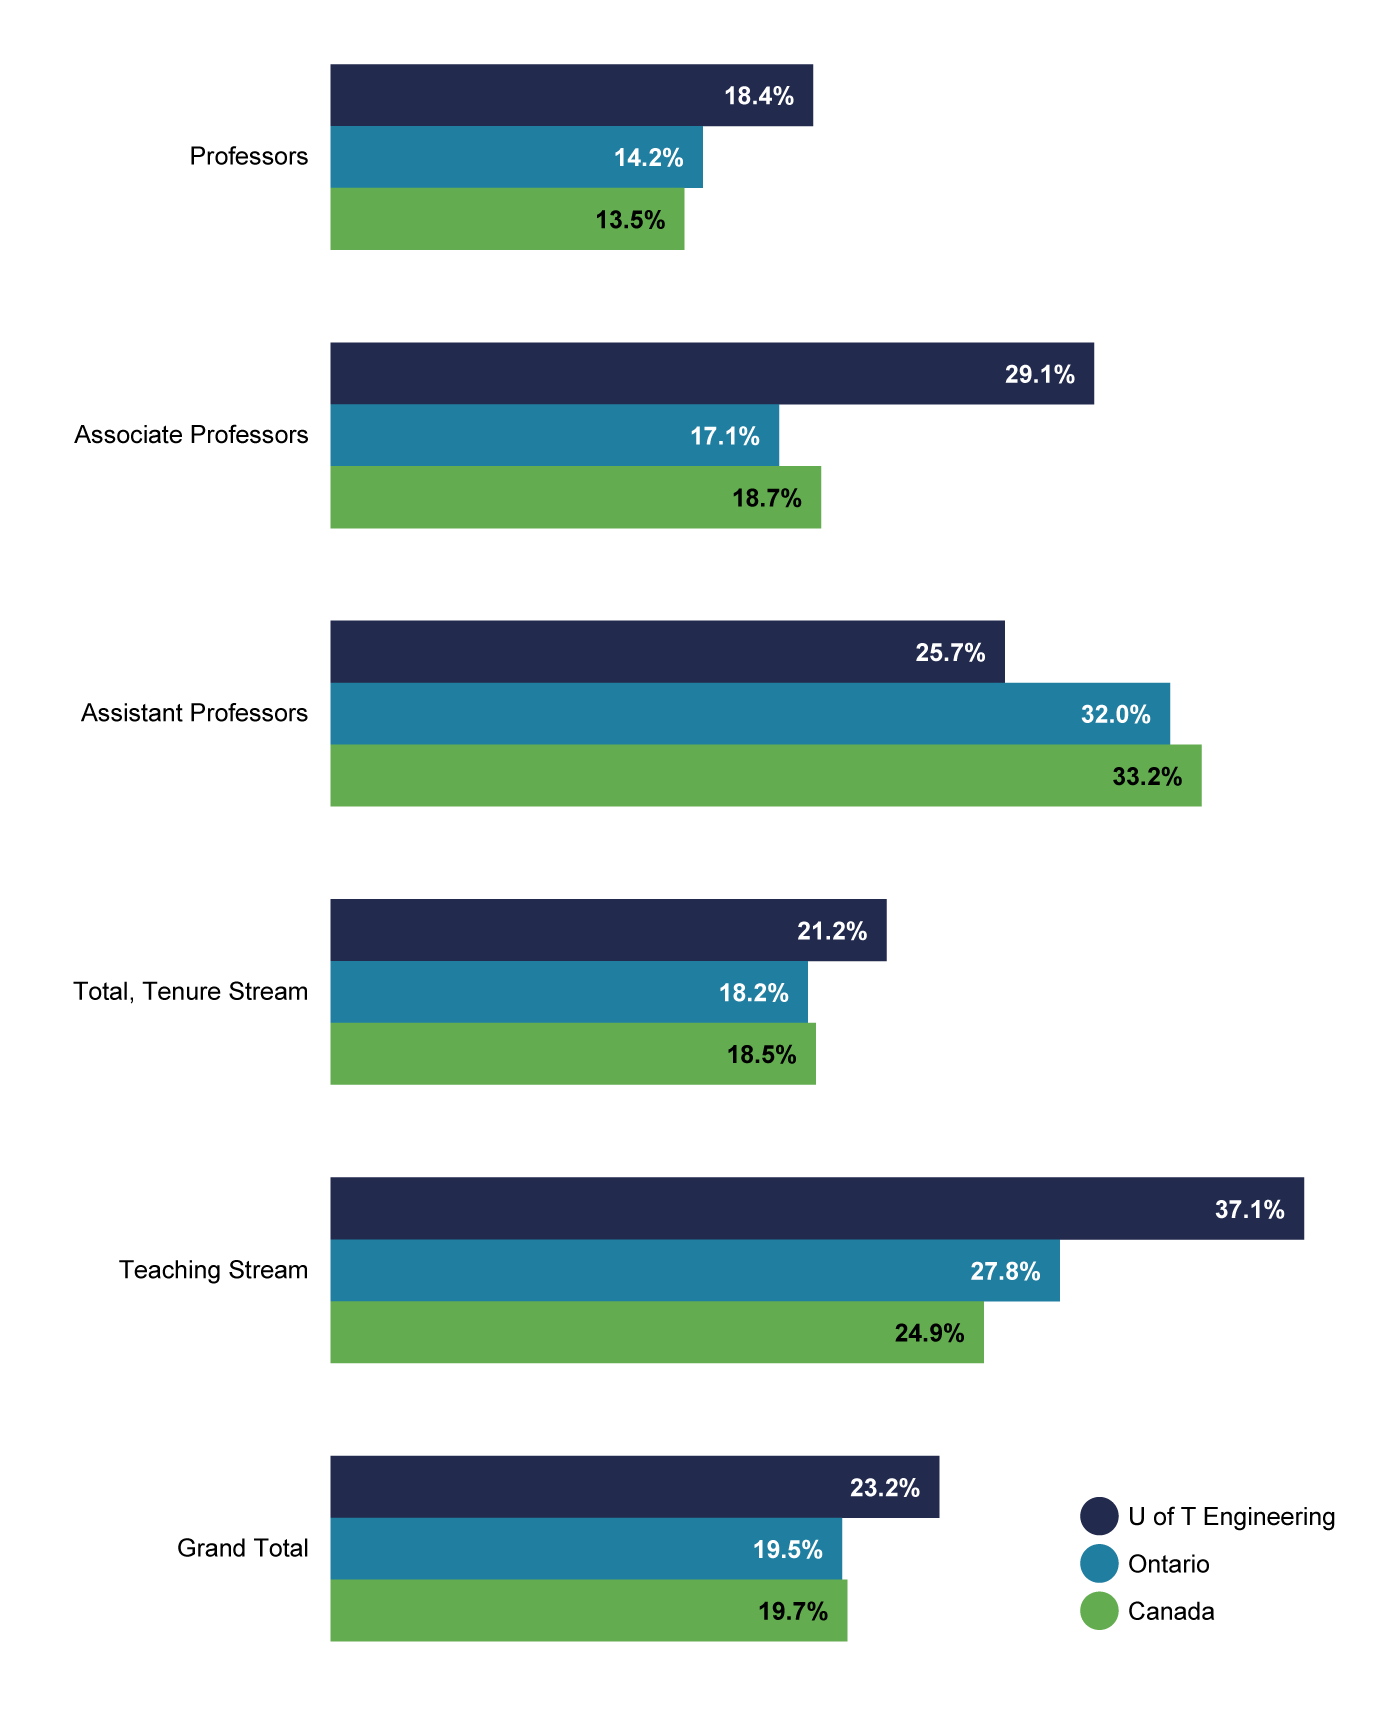
Figure 3.12 Percentage of Women Faculty at U of T Engineering compared with Women Faculty in Ontario and Canadian Engineering Faculties, 2022
Data for this figure is based on Engineers Canada’s Enrolment and Degrees Awarded Report; 2022 is the most recent year for which this report is available. This report counts full-time equivalent faculty positions, whereas all other figures in this chapter show headcounts.
Figure 3.15 Summary of Progress against the Recommendations of the Blueprint for Action (2018), as prepared by the Eagles’ Longhouse (Engineering Indigenous Initiatives Steering Committee), 2024
Immediate Actions (2018)
| Recommendation | Progress |
|---|---|
| Faculty & Staff — 1: Create an Indigenous administrative position to begin the process of taking responsibility for the calls to action of the TRC. | A role has been defined and recruitment has begun through personal networks, however no formal job has been posted. |
| Faculty & Staff — 2: Support a program focused on the recruitment and hiring of Indigenous faculty and staff. | In 2018, 2019 and 2020, a U of T Engineering delegation went to the Canadian Indigenous Science and Engineering Society annual gathering, meeting with current Indigenous community members with potential to become U of T Engineering undergraduate and graduate students, faculty and staff. Some recent positions have been advertised via the job board of the Native American and Indigenous Scholars Association, the world’s largest association of scholars working on Indigenous issues and with Indigenous communities, however no Indigenous applicants have yet resulted. |
| Faculty & Staff — 3: Offer Indigenous Cultural Awareness seminars to all employee groups. Note: This action strongly overlaps with another recommendation, Indigenous Student Access — 1. Progress items for both actions are cross-referenced to each other. | The Indigenous Cultural Competency Toolkit (ICCT) launched in the summer of 2021. The toolkit includes workshops, events and self-educational tools that have been curated from consultations with U of T’s Indigenous Initiatives Office and Indigenous-identifying community members. All modules have been offered to the U of T Engineering community (students, staff, faculty, alumni and external partners) several times. In its first year, 99 community members completed the full module and 330 completed at least one training within the module. Researchers at U of T Engineering’s Centre for Global Engineering are putting together guidance on working with Indigenous communities. |
| Indigenous Spaces — 1: Ensure the existence of plentiful spaces for Smudging Ceremonies. | A smudging ceremony was held in the Myhal Centre for Engineering Innovation & Entrepreneurship lobby in 2017. Guidance on Indigenous Ceremonial Practices Involving Fire or Smoke is available on the U of T Engineering Hub. In June 2024, the Faculty’s Inclusivity, Diversity & Equity Advisory Committee (IDEA) group met with the planning committee to advocate for EDI and Indigenous voices on that committee. |
| Indigenous Spaces — 2: Use a participatory design approach, with key members of Indigenous communities, to (re)develop existing spaces as Indigenous spaces. | The outdoor patio adjacent to the Bahen Centre is being redesigned. The design committee is discussing ways to feature the close connection between Indigenous people and the land, the importance of water in Indigenous culture and/or bring attention to the failing of the engineering infrastructure to supply safe drinking water to Indigenous communities. Early discussions have taken place on how U of T Engineering can be more connected to First Nations House and the Indigenous spaces there. As part of the Indigenous Design and Engineering Academy program run by Engineering Outreach, a prototype sweat lodge has been constructed at the Camp facility operated by U of T Engineering near Minden, Ontario. |
| Indigenous Spaces — 3: Use a participatory design approach, with key members of Indigenous communities, to commission Indigenous artwork. | Anishinaabe artist Solomon King was commissioned to complete a sculpture (footprint 5’ x 2’) celebrating the Gull Lake experience. Currently on display in the Professional Masters’ Student lounge on Level 6 of the Myhal Centre, it will be moved to the new structure at Gull Lake when complete. King was also commissioned to create a larger art piece, Notes from the Earth, to be permanently displayed on the wall of the southern staircase, Level 2, in the Myhal Centre. The unveiling took place in August 2022. |
| Indigenous Spaces — 4: Use a participatory design approach, with key members of Indigenous communities, to establish educational installations located within U of T Engineering space. | No advancement. |
| Indigenous Spaces — 5: Form an ongoing Indigenous Space committee, with Indigenous community members, with ongoing funding tasked to identify additional spaces for naming and/or (re)development as Indigenous spaces, locations for Indigenous artwork and educational installations. | No advancement. |
| Indigenous Spaces — 6: Work with Indigenous language experts to identify and display Indigenous names within the Faculty where appropriate. | No advancement. |
| Indigenous Spaces — 7: Create a prominent, permanent physical representation of the land acknowledgement. | No advancement. |
| Indigenous Student Access — 1: Implement ongoing cultural competency training for all staff and faculty. Note: This action strongly overlaps with another recommendation, Faculty & Staff — 3. Progress items for both actions are cross-referenced to each other. | The Indigenous Cultural Competency Toolkit (ICCT) launched in the summer of 2021. The toolkit includes workshops, events and self-educational tools that have been curated from consultations with U of T’s Indigenous Initiatives Office and Indigenous-identifying community members. All modules have been offered to the U of T Engineering community (students, staff, faculty, alumni and external partners) several times. In its first year, 99 community members completed the full module and 330 completed at least one training within the module. Researchers at U of T Engineering’s Centre for Global Engineering are putting together guidance on working with Indigenous communities. |
| Indigenous Student Access — 2: Begin targeted recruiting for Indigenous students. | Multiple U of T Engineering entrance scholarships for Indigenous students (domestic tuition plus stipend) have been created. Some examples include:
A virtual information session was held in partnership with the Indigenous Recruitment Officer from the Office of Student Recruitment on supports, resources and services provided by First Nations House. The recording of the session was also sent to all self-identified Indigenous applicants. A select group of admitted self-identified Indigenous applicants were invited to campus through the Indigenous Travel Award, providing them with financial support to visit campus and to hear directly from members of the U of T and U of T Engineering community. In the Winter 2023 semester, MIE committed to providing additional support for NSERC undergraduate summer research award recipients who self-identify as Indigenous or Black to enhance their ability to obtain research experience. At least one Indigenous student joined the department for summer 2024, working in the lab of Professor David Sinton. In January 2021, U of T Engineering joined six Ontario higher education engineering faculties to create the Indigenous and Black Engineering & Technology (IBET) Momentum Fellowships. U of T Engineering is providing two of these fellowships per year over the period of 5 years, with each fellowship providing $25,000 per year for four years per student. The first Indigenous IBET recipient, Raylene Mitchell (MIE) joined U of T Engineering in the fall of 2023. |
| Indigenous Student Access — 3: Create a full-time position, to be held by an Indigenous hire, to coordinate cultural competency training and outreach and recruitment of Indigenous students. | See progress for Faculty & Staff — 1 |
| Indigenous Student Access — 4: Create a separate Access Pathway to engineering studies for Indigenous students. | No advancement. |
| Indigenous Student Access — 5: Begin building relationships with Indigenous communities. | Several U of T Engineering professors are currently in the relationship-building phase for potential future research projects with various Ontario First Nations. These relationships may lead to future opportunities for student access. Researchers at U of T Engineering’s Centre for Global Engineering are putting together guidance on working with Indigenous communities. |
| Indigenous Student Access — 6: Determine if a process is needed to verify student applicant claims for Indigenous background. | Under development. |
| Indigenous Curriculum — 2: Run regular Blanket Exercise events for U of T Engineering students, staff and faculty. | See progress for Faculty & Staff — 3 and Indigenous Student Access — 1 |
Short-term Actions (2019–2021)
| Recommendation | Progress |
|---|---|
| Faculty & Staff — 4: Work toward making U of T an employer of choice for the Indigenous community. | Outreach to Indigenous communities, for example, through the Native American and Indigenous Scholars Association, has begun. |
| Faculty & Staff — 5: Provide support for Indigenous employees. | No advancement. |
| Faculty & Staff — 6: Community outreach. Expand and develop relationships with communities. Create community partnerships. Establish connections with Indigenous professionals in the community, such as Aboriginal Professionals Association of Canada. | Several U of T Engineering professors are currently in the relationship-building phase for potential future research projects with various Ontario First Nations. Indigenous Design & Engineering Academy (IDEA) is a set of enrichment programs created through the U of T Engineering Outreach Office in 2021. IDEA offers Land-based learning to inspire Indigenous elementary and secondary students to pursue an engineering education and career, while reinforcing the many ways scientific knowledge is ingrained in Indigenous culture and traditions. IDEA has two streams: Horizons for elementary students and Leaders In Training (LIT) for secondary students. In the summer of 2023, 21 students participated in IDEA Horizons and 6 more in IDEA LIT. In total, nearly 60 spots have been filled across both programs since their inception. |
| Faculty & Staff — 7: Provide financial support for Elder services. Work with First Nations House and the Provost’s Office of Indigenous Initiatives to determine how best to provide Elder support at U of T Engineering. | No advancement. |
| Indigenous Spaces — 8: Create an Indigenous Office within U of T Engineering. | Negotiations about organizational structure and space have begun and continue between U of T Engineering Indigenous community and the Faculty. |
| Indigenous Student Access — 7: Initiate a pilot engineering outreach program for Indigenous high school students. | Indigenous Design & Engineering Academy (IDEA) is a set of enrichment programs created through the U of T Engineering Outreach Office in 2021. IDEA offers Land-based learning to inspire Indigenous elementary and secondary students to pursue an engineering education and career, while reinforcing the many ways scientific knowledge is ingrained in Indigenous culture and traditions. IDEA has two streams: Horizons for elementary students and Leaders In Training (LIT) for secondary students. In the summer of 2023, 21 students participated in IDEA Horizons and 6 more in IDEA LIT. In total, nearly 60 spots have been filled across both programs since their inception. |
| Indigenous Student Access — 8: Create a transition program for Indigenous students. | An informal community of Indigenous undergraduate students has been established, with communication taking place via a Discord server. A common experience interest in beading was identified through that online community and expanded into a beading workshop in December 2021. |
| Indigenous Student Access — 9: Expand the Indigenous outreach program. | Indigenous Design & Engineering Academy (IDEA) is a set of enrichment programs created through the U of T Engineering Outreach Office in 2021. IDEA offers Land-based learning to inspire Indigenous elementary and secondary students to pursue an engineering education and career, while reinforcing the many ways scientific knowledge is ingrained in Indigenous culture and traditions. IDEA has two streams: Horizons for elementary students and Leaders In Training (LIT) for secondary students. In the summer of 2023, 21 students participated in IDEA Horizons and 6 more in IDEA LIT. In total, nearly 60 spots have been filled across both programs since their inception. |
| Indigenous Student Access — 10: Create an Indigenous Office within U of T Engineering. | See progress for Faculty & Staff — 1 |
| Indigenous Student Access — 11: Work with colleges in northern and remote areas to increase engineering programming in colleges (such as first year engineering design) and facilitate the transfer of college credits. | Discussions are underway regarding a Diploma to Degree program being developed for the Sciences at U of T. It is possible that U of T Engineering could participate in this program as a first step towards a transition program. While this specific program is not targeting a northern or remote area, it could generate expertise within the Faculty that could then be extended to northern and remote areas |
| Indigenous Curriculum — 1: U of T Engineering should take an integrated approach to bringing Indigenous content to the engineering curriculum, and NOT add additional courses. | A recorded short lecture was created for APS111 that gives a Land Acknowledgement but also explains the purpose and history of Land Acknowledgements. Professor Jason Bazylak gave a lecture on Design Stakeholders using the case study of the Shoal Lake 40 First Nation and the Winnipeg aqueduct. Bazylak has connected with other institutions to develop this into a learning module that could be widely distributed. In February 2024, Professor Bazylak also presented at the AISES - Canada conference on integrating a Medicine Wheel framework into design evaluations. |
| Indigenous Curriculum — 4: Better communicate engineering as a community builder. | A presentation to incoming Indigenous students on the importance of Indigenous engineers to build infrastructure for Indigenous communities was incorporated into the Welcome to Engineering event. This material could also be shared via the IDEA program run by Engineering Outreach. |
| Indigenous Curriculum — 5: Hire one or more Indigenous curriculum developers. | No advancement. |
Long-term Actions (2022–2024)
| Recommendation | Progress |
|---|---|
| Faculty & Staff — 8: Take a Seven Generations approach to the Faculty’s relationship with Indigenous Peoples. | No advancement. |
| Indigenous Spaces — 9: Spearhead the call for the Front Campus redesign to incorporate prominent Indigenous space. | No advancement. |
| Indigenous Spaces — 10: Create a symbol of Indigenous Engineering Positive Space. | No advancement. |
| Indigenous Student Access — 12: Establish a pilot engineering program in a remote community. | The Reconciliation Through Engineering Initiative (RTEI) aims to find sustainable engineering solutions through community-driven, multidisciplinary and Two-Eyed Seeing collaborations, leveraging the expertise of both Indigenous community members and U of T researchers specializing in diverse fields. Overseen by the Centre for Global Engineering, RTEI will ultimately identify six projects to improve access to clean drinking water, food security, housing, health care, transportation and communication systems in Indigenous communities across Canada. |
| Indigenous Curriculum — 3: Create an Indigenous culture infusion lecture series. | A talk titled Indigenous Engineering Design, Ethics, and Role Models was given in November 2021 by John Desjarlais and Matthew Dunn, co-presidents of the Saskatchewan Professional Chapter of the Canadian Indigenous Science and Engineering Society. ISTEP also hosted a presentation titled The Role of Professional Engineers in Truth & Reconciliation, a presentation by Jessica Vandenberghe, Industry Professor, Indigenous Engineering at the University of Alberta. |
Figure 3.16 Summary of Progress against the Recommendations of Striving Toward Black Inclusivity (2019) as Prepared by the Black Inclusion Steering Committee, 2024
Interim Recommendations (from November 2018)
| Recommendation | Progress |
|---|---|
| Establish an Equity, Diversity & Inclusion (EDI) office | A new role of Assistant Dean and Director of the Office of Diversity, Inclusion and Professionalism (DIP) was established in 2019. Professional engineer Marisa Sterling (ChemE) became the first to hold the position. In 2022, the DIP Office expanded to include the role of Associate Director, Access and Inclusive Pedagogy, and a Program Officer to develop EDIA education tools. The DIP Office since 2020 has also hired a member of the NSBE U of T Chapter each year as a work-study student to co-develop a Black access strategy. The Dean has continued to annually appoint an Advisor on Black Inclusivity Initiatives since 2018 who collaborates with the DIP Office. Since 2023, the role has been held by Professor Philip Asare (ISTEP, EngSci) who brings experience building Black inclusion at another higher education institution. Since 2022–23, other administrative offices have hired additional staff, one in the First Year Office and one in the Alumni Relations Office, with a partial mandate to support EDI and work in partnership with the DIP Office. In 2022–2023, the DIP Office launched the Black Cultural Competency Toolkit, (BCCT) which builds on the model of the Indigenous Cultural Competency toolkit launched in 2021. Through readings, videos, and other resources, the BCCT supports faculty and staff as they start or continue their personal learning journeys toward improving Black inclusion and excellence. In partnership with the Associate Dean, Cross-Disciplinary Programs and the DIP Office, a new undergraduate certificate in Justice, Equity, Diversity and Inclusion was approved by Faculty Council and launched in September 2023. |
| Collect race-based data | Since 2020, the collection of race-based data within the Faculty has increased. The Engineering Applicant Census (EAC) was developed by a working group consisting of members of the Engineering Equity, Diversity and Inclusion Action Group (EEDIAG), the Registrar’s Office, the Dean’s Advisors on Black and Indigenous Inclusion and the DIP Office. The EAC was piloted in the 20202021 application cycle and has been continued annually since. It was adopted university-wide as the Student Applicant Census (SAC) in 2021–2022. The data collected intersectionally includes race, ethnicity, gender, spirituality, disability and socio-economic status. It is not used directly in admissions decisions, but instead is used by the Registrar’s Office and the Office of Diversity, Inclusion and Professionalism to send recruitment and admissions resources and entrance awards information to applicants upon request, and to understand potential barriers in the engagement and admission process for different communities. More than 75% of applicants opt to complete the EAC. In 2021–22, the university’s School of Graduate Studies began collecting race-based data on applicants annually as a requirement of the graduate school application. Therefore, the response rate is 100% with a “prefer not to answer” option within the survey. The data is released annually each May in aggregate form to Engineering. In 2022–23, Engineering’s First Year Office, in partnership with the Registrar and Office of Diversity, Inclusion and Professionalism, began collecting race data on first year students within the First-Year Survey. The survey was made mandatory for all Core-8 students as part of the APS100 course and optional for Engineering Science students. With a “choose not to answer” option, survey completion rate was close to 100%. In 2023, the Student Equity Census was embedded in the student portal and is required for all students to complete. In addition, the university updated its Employment Equity survey so that every employ is promted to respond, even if only to decline answering. Employees can update their information at any time through the employee portal. |
| Acknowledge and support Black History Month (BHM) | Led by Engineering Strategic Communications, with input from the Office of Diversity, Inclusion and Professionalism and partners within the U of T Engineering community, Black History Month communications campaigns have been developed and executed annually since 2019. The BHM 2024 campaign kicked off with messaging to faculty, staff and students about the Black Cultural Competency Toolkit. It also included a news story about the Outreach Office’s Blueprint program and promotion of the IBET Momentum Fellowships. For the past six years, U of T Engineering has also been the premium sponsor of NSBEHacks. In 2024 NSBEHacks attracted more than 250 high school, undergraduate and graduate Black students for a weekend-long hackathon. At the 2024 hackathon, the DIP Office delivered the keynote to open the Hackathon, departments delivered workshops, the Graduate Office participated in the career fair and the DIP office developed a student challenge to hack an urban experience to innovate and improve the access and engagement to people who self-identify as Black. In total, 50 final projects were developed. |
| Enhance and streamline communication to advertise and build inclusivity efforts | The EDI webpage launched in 2018. The annual statement on “Our Shared Values of Diversity, Equity and Inclusivity” is now jointly made between the Graduate Engineering Council of Students (GECoS), the undergraduate Engineering Society (EngSoc), and the Engineering Alumni Association along with the Dean and Assistant Dean, Diversity, Inclusivity and Professionalism. In January 2021, U of T Engineering launched a confidential disclosure process for incidents of bias, discrimination, harassment, or harmful unprofessionalism. A webpage and online form allow community members to disclose, with the first follow-up guaranteed within three business days. This portal is publicized regularly on the main Faculty website, in the Faculty & Staff Newsletter and on social media. The EDI webpage also hosts the self-directed modules of the Black Cultural Competency Toolkit, launched in February 2023. |
| Have Black representation at departmental and Faculty seminar/lecture series | In response to the recommendation proposed at the Chairs and Directors meeting in 2019, departments/institutes including ISTEP and ECE have intentionally brought in Black academics to speak on their research via lecture series and seminars. In 2023, this was expanded to include prominent Black figures in the technology sector in collaboration with the Black Founder’s Network. In 2021, the University of Toronto’s Anti-Black Racism Task Force also recommended a lecture series to provide a platform for Black excellence in research. |
| Have targeted Black undergraduate student recruitment | In the summer of 2020, the Blueprint program launched as a four-week summer program for highly motivated Black students in Grades 9–12. Blueprint was held online during the pandemic and returned to in-person in 2023. Approximately 30–50 students from across Canada participate each summer, and engagement with students continues during the academic school year. From 2021–2023, 12 Blueprint alumni joined U of T Engineering as undergraduate students, with seven more having accepted their offer of admission for Fall 2024. In 2022–2023, the Black Applicant Support and Engagement program (BASE) launched to demystify for Black high school students the path to post-secondary engineering education at the University of Toronto. This free program provides Black-identifying Grade 12 students with a customized experience and resources to assist them through the challenges of the university application and decision-making process. Twenty students participated in the program’s first year. The Faculty received financial assistance for this Black applicant community of support from the Access Programs University Fund (APUF) within the Office of the Vice President & Provost. The Recruitment Office continues to collaborate closely with the NSBE U of T Chapter on increasing the visibility of the Black student community and creating connections for prospective students. This has included hosting dedicated student panels, ensuring Black representation in clubs, fairs and open houses and providing admissions presentations at the High School Conference and NSBEHacks. Professor Myrtede Alfred (MIE) became NSBE’s faculty advisor from 2022–2024. Data from the Engineering Applicant Census (EAC) informed the creation of the Black Student Community Welcome event to celebrate Black admitted students and facilitate connections to the U of T Engineering community. |
| Increase involvement at the NSBE National Convention | The Faculty — primarily through the Office of Diversity, Inclusion and Professionalism, and with support from the Vice Dean Graduate and Troost ILead — has provided increasing financial support to Black undergraduate and graduate students to attend the NSBE National Convention in-person to network, build community and learn skills. In 2024 this increased to 21 students, of which 15 were undergraduates. U of T Engineering was also a sponsor for the 2022 and past NSBE National Conventions and led recruitment activities. |
Additional Recommendations (from September 2019)
Prospective and Current Undergraduate Students
| Recommendation | Progress |
|---|---|
| Continual review of broad-based admission goals and procedures to further enhance the equitable and inclusive nature of general admissions | In the summer of 2021, the Registrar’s Office formed a working group with the DIP Office and the First Year Office to review and enhance the use of broad-based and extracurricular admission metrics with respect to Black inclusivity. In 2022, the Department of Chemical Engineering and Applied Chemistry (ChemE) admissions committee invited this working group to share their findings and recommendations for what the admissions committee should consider in admissions procedures with and equitable lens. In 2023, the departments’ admissions committees were informed of which applicants were accepted into the Faculty’s Blueprint high school academic enrichment program as additional information, as well as provided with aggregated demographic data of the past years of applicants and the percentages by department that self-identified as Black. |
| Develop alternative, gap-spanning admission and/or access pathways into U of T Engineering | The Blueprint program was created for motivated Black students in grades 10–11 who are passionate about science and engineering. After the four-week academic enrichment experience, U of T Engineering remains in contact with the students over a multi-year long engagement to encourage and support them in the university application process. In addition, the Black Applicant Support and Engagement (BASE) program was created in 2021 to span gaps in the existing admissions process and reach grade 12 Black students who did not participate in Blueprint, but want to apply to U of T Engineering. BASE guides students through the OUAC process, navigating financial aid, and finding community at U of T Engineering through connections with the local NSBE chapter. In 2022, an online pre-Calculus program called ePUMP (Preparation for University Math Program) was created with $190K from the Dean’s Strategic Fund. This open educational resource is planned to launch to both incoming and pre-university students and will provide students with time constraints or math competency gaps to prepare for university admissions. |
| Develop a centralized peer mentorship initiative | The successful Engineering Campus Experience Officer (Eng CEO) program is run annually with mentors who represent a wide range of disciplines, years of study and racial and gender diversity. In 2021, the Office of Diversity, Inclusion and Professionalism built a collaboration between the National Society of Black Engineers (NSBE) U of T Chapter and the Advancement Office to create Black mentorship opportunities within the faculty. In 2022, the Engineering Graduate Connections initiative was launched by Anuli Ndubuisi (OISE PhD candidate), Mai Ali (ECE PhD candidate) and D’Andre Wilson-Ihejirika (ChemE PhD candidate). This student-led initiative aims to create pathways for undergraduate students interested in research to find mentors among current graduate students. |
| Create infrastructure to increase faculty engagement in Outreach | Researchers and principal investigators are advised of possible collaborations with the Engineering Outreach Office when they request an EDI review of their grant applications by the Office of Diversity, Inclusion and Professionalism. |
| Increase access to financial aid and scholarships | U of T Engineering has increased its efforts with prospective donors and alumni interested in providing funding for EDI initiatives and awards. It is estimated that more than 30% of new awards created since 2020 support students who self-identify as Black, Indigenous or members of other communities that have historically been underrepresented in engineering. In February 2022, U of T Engineering launched the U of T Engineering Entrance Scholarship for Black Students. The program provides 10 annual scholarships valued at $10,000 each, and renewable for four years (for a total of $40,000), to incoming domestic Black students. Other examples of awards that support this recommendation include:
|
| Create targeted undergraduate research opportunities | In early 2022, a high-level proposal was drafted by the Dean’s Advisor on Black Inclusivity Initiatives for “Pathways to Research,” a program that would increase research project access to undergraduate students. In 2022, the faculty agreed to support further development of the Pathways to Research Initiative, along with the existing Black Applicant Support and Engagement (BASE) program, with $100,000 in funding from the Access Programs University Fund (APUF) within the Office of the Vice President & Provost. In the summer of 2023, the Faculty leveraged NSERC’s new Black and Indigenous stream for the Undergraduate Student Research Awards (USRA) to provide opportunities for five Black undergraduate students. Additional funding of $6000 was provided by the Office of Diversity, Inclusion and Professionalism to faculty supervisors to further support the students. In the summer of 2024, the faculty will provide six Black domestic students and three Black international students, for a total of 9 students, with Undergraduate Student Research Awards (USRAs) at a value of $6,000 each. This increase was achieved by U of T Engineering adopting a policy direction to remove the minimum GPA requirement and qualify first-year students to apply for a USRA. Additionally, the DIP office took a policy direction to increase access beyond domestic students that NSERC/CIHR will fund to extend research opportunities to international students with funding directly from the DIP office. In 2023–24, the Dean’s Advisor on Black Inclusivity along with the Assistant Dean, Diversity, Inclusion and Professionalism supported a University-wide USRA Review Committee, chaired by the Vice-President Research and Innovation, and advanced many of the Engineering policy changes to be implemented University-wide to increase USRA access to Black students. |
Prospective and Current Graduate Students
| Recommendation | Progress |
|---|---|
| Develop targeted workshop series to promote graduate school and support current graduate students | The Office of the Vice-Dean Graduate has worked with the programs chair of NSBE U of T to offer workshops, info sessions and panel discussions to prospective students on graduate school, the application process and Black alumni insight on the graduate school experience. The Indigenous and Black Engineering & Technology (IBET) Momentum Fellowships were first awarded in Fall 2021 (see progress under “Continue to develop targeted recruitment strategies” below). As part of this program, collaborative efforts between the Office of the Vice Dean Graduate, the Office of Diversity, Inclusion and Professionalism, Mitacs and the national administrators of the IBET program have begun to scaffold supports and programming for IBET fellows to leverage. These program offerings for IBET fellows could act as a foundation for potential offerings to the wider Black student community. Engineering Graduate Connections is a student-led initiative launched in September 2022 by Anuli Ndubuisi (OISE PhD candidate), Mai Ali (ECE PhD candidate) and D’Andre Wilson-Ihejirika (ChemE PhD candidate). The group aims to create pathways for undergraduate students interested in research to find mentors among current graduate students. An informal community of Black graduate students, faculty, and staff began gathering since 2021 and gathering with in-person events since 2022. The U of T Engineering Black Grad & Beyond Group aims to build community among Black graduate students at U of T Engineering. In 2024, a new NSBE chapter formed for Black graduate students at U of T Engineering, under the leadership of a recent IBET Fellow. The Vice Dean Graduate and the DIP office are providing the start-up mentorship and funding for the club and in 2024 supported six Black graduate students to attend the NSBE National Convention. |
| Continue to develop targeted recruitment strategies | In January 2021, U of T Engineering joined six Ontario higher education engineering faculties to create the Indigenous and Black Engineering & Technology (IBET) Momentum Fellowships. U of T Engineering is providing two of these fellowships per year for a total of 10 over a period of five years, with each fellowship providing $25,000 per year for four years per student, or $1M for 10 incoming Black or Indigenous PhD students. In addition, IBET fellows are invited into the Massey College Fellowship. As of 2024, eight IBET Fellowships have been awarded and seven of those eight have been to PhD candidates that self-identify as Black. The IBET fellowship selection criteria were updated for the third cycle to remove any additional academic requirements beyond the departmental requirements and shift the selection criteria to community leadership and impact. Other targeted recruitment strategies include a strong U of T Engineering presence at the NSBE National Convention, the NSEB U of T Hackathon (NSBEHacks) and the Graduate Research Days (GRD) event. Participants in GRD have the option to self-declare their racial/ethnic identity for targeted outreach communications. |
Prospective and Current Faculty Members
| Recommendation | Progress |
|---|---|
| Intentional utilization of Provost Office diversity-driven initiatives | Since 2020, four new faculty members who self-identify as Black were hired across several departments. Two of these hires leveraged the Provost’s new faculty funding program and the Office of Diversity, Inclusion and Professionalism recommends that other departments and divisions follow this model. |
| Develop a framework to facilitate diverse candidate pool formulation and consideration | The Black Inclusion Steering Committee recommended that departments/institutes follow the Office of the Vice-Provost, Faculty & Academic Life document Strategies for Recruiting an Excellent & Diverse Faculty Complement: A guide for enhancing the diversity of applicant pools and minimizing the impact of unconscious bias in assessing candidates. While no formal faculty-wide mechanisms are in place, inclusive and holistic hiring practices are being implemented at a departmental level, which have led to an increase in Black faculty hiring over the last two years. |
| Define the means to value and incentivize EDI and mentoring work for faculty | The Dean’s Advisor for Black Inclusion is one vehicle to incentivize EDI and mentoring as the role is held by a faculty member who receives remuneration for this additional work. |
Prospective and Current Staff Members
| Recommendation | Progress |
|---|---|
| Develop avenues for formal mentorship | In the final Report of the University of Toronto Anti-Black Racism Task Force, one recommendation for staff was “that central Human Resources offices conduct an equity-focused review of all central mentorship programs, examining selection criteria, inclusion, and outcomes, with the goal of creating updated programs that are inclusive of Black, Indigenous, and racialized employees’ needs and aspirations.” The informal FASE Black Grad & Beyond Group includes Black staff members and builds connections between them and Black faculty and graduate students. The group also connects with the Anti-Racism and Cultural Diversity Office (ARCDO) and other Black community groups at U of T. |
| Provide opportunities for affinity group community building | Since 2020, the FASE Black Grad & Beyond Group has formed as an affinity group for Black staff, faculty and graduate students. The group meets several times a year to network and provide mutual support. Other staff affinity groups include Engineering Positive Space where Black 2SLGBTQ+ staff can find community with faculty and others. |
| Improve access to secondment and professional development opportunities | In the Report of the University of Toronto Anti-Black Racism Task Force, one recommendation made for staff was for HR offices to “leverage existing programs and talent pools to identify suitable Black staff for special project/secondment/promotional opportunities” across the university that are not only related to EDI issues, but that are focused on core operational projects. |
General
| Recommendation | Progress |
|---|---|
| Integrate broader EDI considerations into Alumni and Advancement Office operations | The Advancement & Alumni Relations Office continually works with the Outreach Office and the Office of Diversity, Inclusion and Professionalism to identify and develop funding proposals for access and support initiatives. In 2022, Oje Izirein was hired as an Alumni Relations Officer to action EDI considerations. The office has also been actively working to strengthen ties between U of T Engineering and identity-based student groups, such as the National Society of Black Engineers at both the undergraduate and graduate level. The office is also building an ongoing relationship with the U of T Black Alumni Association to collaborate on programming and help grow their membership. |
| Develop more equitable and accessible modes of financial reimbursement and invoice generation | The Engineering Equity, Diversity and Inclusion Action Group (EEDIAG) has mediated conversation between the managers/directors in Decanal offices and the Decanal Finance Team responsible for overseeing the mechanisms for financial reimbursement, invoice generation and acknowledgement of EDI-based expenditures in operational budgets. Following these conversations and the work of advocates within the faculty, some barriers in funding mechanisms have been reduced. The faculty is a participant in a pilot program for Social Procurement. In 2023 and 2024, significant reductions in EDI funding were made due to faculty budgetary constraints however funding for Black initiatives has been maintained and increased. |
| Offer and incentivize more equity and cultural competency training for staff/faculty | In February 2023, the Office of Diversity, Inclusion and Professionalism launched the Black Cultural Competency Toolkit (BCCT). This self-directed, three-module toolkit helps faculty, staff and students learn Black history in Canada, understand the diversity of Black identities and take action-oriented steps towards positive change in STEM. U of T Engineering community members are encouraged to commit at least two hours per module and to track their progress using the online form provided. EEDIAG continues to offer learning opportunities for the faculty in partnership with ARCDO and the DIP Office. Past sessions include “Addressing Anti-Black Racism & Unpacking Active Allyship” in June 2020, and “Understanding your responsibility to preventing racial discrimination & harassment in the working and learning environments” in February 2023. The EEDIAG also compiles resources to address Anti-Black Racism. Workshops held by the Anti-Racism and Cultural Diversity Office (ARCDO) and other organizations on campus are collected and highlighted on the BCCT website and on the faculty’s main EDI website. |
| Establish hard targets for representation at all Faculty levels | While the faculty and the university are now collecting demographic data on students, staff and faculty, no targets have been established. And when there are researcher targets, for example in the Canada Research Chairs program, the group is termed racialized and not disaggregated to look at Black representation. |
Figure 3.17 Summary of Progress against the Recommendations of the Final Report (2019) of the Joint Task Force on Academic Advising and Mental Health, 2024
Undergraduate Experience
| Recommendation | Progress |
|---|---|
| 1 — Continue to foster a culture of caring and support at U of T Engineering and destigmatize mental health challenges. | Over the past year, U of T Engineering has continued to foster a culture of care and support and has worked towards destigmatizing mental health challenges through different activities. In-person Mental Health & Wellness “Build U Up” events took place in October 2023 and February 2024, together drawing more than 280 students. Recognizing the high costs related to mental health care, U of T Engineering has introduced the Skule™ Mental Health Bursary for students and Microgrants for Mental Health for student groups to provide financial aid for wellness initiatives. While progress has been made in this area, there is always more work to be done and continual improvements to be made. More in-person activities, collaboration with other departments and student groups are planned for the new school year, and a Community of Practice has been founded to help co-ordinate synergy between these initiatives. |
| 2 — Creation of a Dean’s Advisory Committee on Student Mental Health and new Student & Community Wellness Coordinator position in the faculty. | In May 2020, U of T Engineering created a new continuing Student & Community Wellness Coordinator position at the faculty. This role is currently stewarded by Teresa Woo. While there has been on going consultation among staff and faculty on student mental health, a formal Dean’s Advisory Committee on Student Mental Health has not been created. |
| 3 — Offer and promote more mental health training resources to U of T Engineering staff and faculty. | The following mental health trainings and resources have been updated and made available to staff and faculty:
|
| 4 — Identify student mental health and wellness training for all student-facing staff (academic advisors, front line student services, instructors, teaching assistants, etc.) | Student-facing staff are encouraged to take the following mental health and wellness trainings to prepare for their roles:
|
| 5 — Ensure new job postings and interview questions for academic advisors include language related to advising-based competencies. | New job postings and interview questions have been suggested to U of T Engineering’s HR department for inclusion and use when hiring Academic Advisors. |
| 6 — Create a full-time academic advisor position to support first-year international students in the First Year Office and make Engineering Science’s new academic advisor position permanent after the one-year contract ends. | In August 2019, the Undergraduate Advisor (Engineering Science Years 1 & 2) position became a continuing position and welcomed Stephen Johns into the role. In March 2020, the First Year Office created the new position of First Year Advisor, Intercultural Learning & Experience. The position is currently held by Brianna MacDonald. In April 2020, the Division of Engineering Science created the new position of Undergraduate Student Advisor (Engineering Science Years 1 & 2, International). Irma Berardi was welcomed into this position in August 2022. |
| 7 — Review academic advising caseloads, frequency of complex cases and petition volume by department/division. | An initial review of caseloads, frequency of complex cases and petition volume was completed in 2019. These items are continually monitored and discussed in monthly academic advising network meetings with the Assistant Registrar, Student Records and Services. |
| 8 — Development of a proactive advising notification system in the Academic Advising Portal. | The Registrar’s Office piloted the development of a proactive advising notification system with the First Year Office. This tool is being integrated into other departments (e.g., MIE) for second-year students as well. Additional proactive advising measures were reviewed through the strategic planning process of the Registrar’s Office in Summer 2022. Review and discussion were carried out in April 2023 to collect feedback from Portal users for improvement and system upgrades. |
| 9 — Standardize academic advisors’ out-of-office and autoresponse messages to include links to helpful resources and services. This effort could be applied to all staff who regularly interact with students. | A standardized out-of-office and auto-response message was created and promoted to Academic Advisors and added to the Academic Advisors Handbook. The use of this practice is also encouraged for student-facing staff, and has been adopted by others (e.g., Learning Strategist) |
| 10 — Increase the number of scholarships that recognize U of T Engineering students who have overcome challenges. | To date, the following scholarships recognize U of T Engineering students who have overcome challenges:
The Engineering Students Emergency Grants is a one-time, non-repayable financial awards for Engineering students facing exceptional one-time costs due to unanticipated, extraordinary situations. Emergency grants are a support of last resort. The Graduate Academic Wellness Bursary was initiated in 2021 as a joint initiative between the Graduate Engineering Council of Student (GECoS) and the Office of the Vice-Dean, Graduate to provide some financial support to graduate students who have faced difficulties in maintaining their academic progress due to mental and physical health challenges. The QueerSphere Graduate Crisis Counselling Fund was piloted in Winter 2022 in partnership with the Office of the Vice-Dean, Graduate and QueerSphere’s Graduate Chapter. This fund is intended for members of QueerSphere’s Graduate Chapter if they find themselves in need of financial aid to cover the cost of counselling care after they have expended their coverage through the UTGSU Health and Dental Insurance, the CUPE 3902 Unit 1 Health and Dental Top Up Plan, or any other extended benefit coverage plans or free services offered by the University (e.g., Health & Wellness, MySSP) they may have attempted to use. |
Graduate Experience
| Recommendation | Progress |
|---|---|
| 1 — Increase specificity and consistency of graduate student orientations across the faculty. | Starting in August/September 2021, all first-time TAs were provided asynchronous training on: Academic Integrity; Equity, Diversity & Inclusion; Supporting Student Mental Health; Student Privacy & Protection and Student Privacy & Protection for Virtual Instruction. The Office of the Vice-Dean, Graduate also collaborated with the Graduate Engineering Council of Students to develop an orientation template containing helpful information new incoming students should know about. These slides were shared with individual graduate units once again in Fall 2021 so they could add their own specific programming and information to the slides that pertain to their own students. Additionally, all grad units were strongly encouraged to host a winter orientation session as well. The Office of the Vice-Dean, Graduate is working with the Graduate Engineering Council of Students (GECoS) to continually improve the student transition experience and will be meeting in the summer to discuss improvements. |
| 2 — Explore options for graduate chairs to assess the levels of support available for research-stream graduate students and the climate created by their supervisors. | The Office of the Vice-Dean, Graduate piloted a system to receive anonymous feedback from graduate students in MSE on their student experience, including their supervision experience. The results were shared with faculty by the chair to bring awareness to student concerns. |
| 3 — Clarify supervisory expectations by setting guidelines for personal time off and by promoting best practices in graduate supervision within the faculty. | The SGS document on best practices in graduate supervision has been promoted to new faculty members during the yearly orientation session organized by the Office of the Vice-Dean, Research. Guidelines regarding time off were also discussed. Recent changes to the domains of the Engineering Graduate Education Committee, a standing committee of the Faculty, will make it possible in the future to reinforce best practices and uniformity across U of T Engineering in these areas. In collaboration with GECoS, two town halls with the Dean were organized in 2021-2022. In preparation for those town halls, student surveys were conducted which provided questions that could be answered by the Dean and Vice-Deans about topics such as supervisor expectations and wellness resources. |
| 4 — Reduce barriers for research-stream graduate students who need to take medical leaves of absence. | Course syllabus templates were distributed to instructors. These templates include links to SGS policies that pertain to leaves of absence. A webpage has been dedicated to mental health and wellness resources on the graduate studies website of the faculty. This page includes links to SGS policies. |
| 5 — All graduate administrators should complete Identify, Assist, Refer (IAR) Training and be encouraged to take additional health and wellness training. | Graduate administrators are encouraged to take the following mental health and wellness trainings to prepare for their roles:
|
| 6 — Create clear policies for missed work and late withdrawal in graduate and 500-level courses. | Recently, the domains of the Engineering Graduate Education Committee and also the Undergraduate Examination Committee, two standing committees of the faculty, have been modified to address and clarify the process to petition 500-level courses. These changes became effective in the 2021–2022 academic year. |
| 7 — Make the graduate course schedule available on a centralized website prior to course registration. | All department courses are listed online, with a link from the main faculty website for easy access. |
| 8 — Continue to support graduate student mental wellness groups. | The faculty has continued to provide funding for GECoS to support their Mental Health and Wellness Commission. The faculty has introduced the Graduate Academic Wellness Bursary to support students who have unanticipated COVID-19 related expenses regarding health and wellness supports since Fall 2021. The fund has now expanded to support students who faced difficulties in terms of maintaining their academic progress due to mental and physical health challenges, not just COVID-19 related health challenges. The faculty continues to conduct regular meetings with GECoS to receive updates on student concerns, including wellness of students. |


