


By the Numbers 2025
Explore comprehensive visual data about the Faculty in this companion piece to our 2025 Impact Report
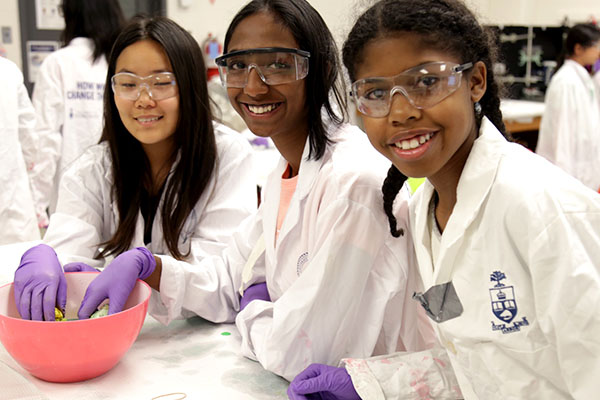
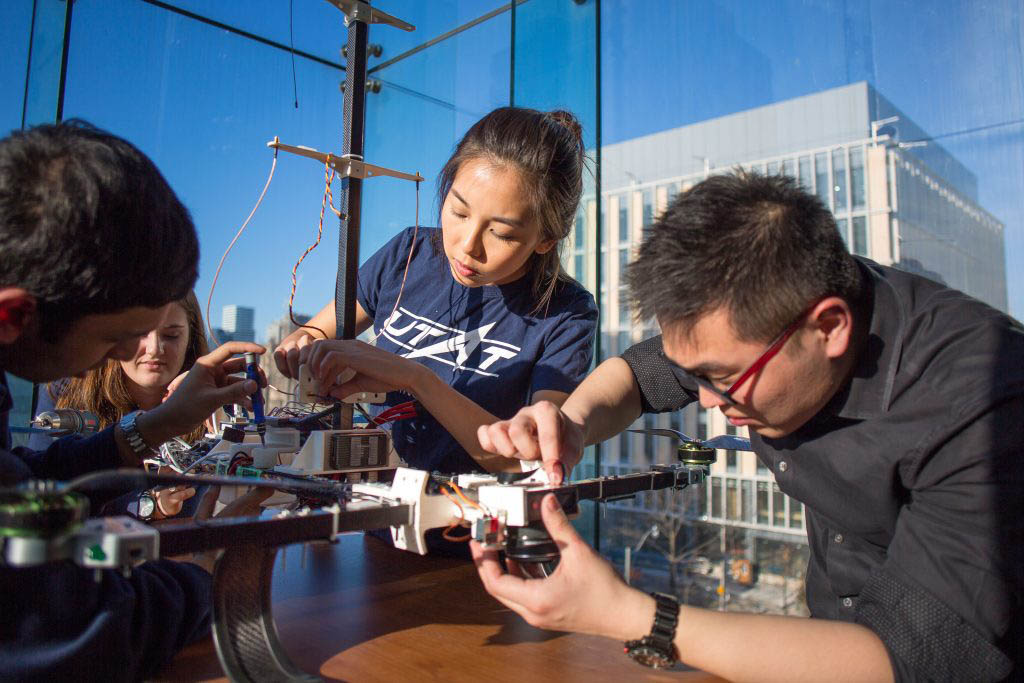
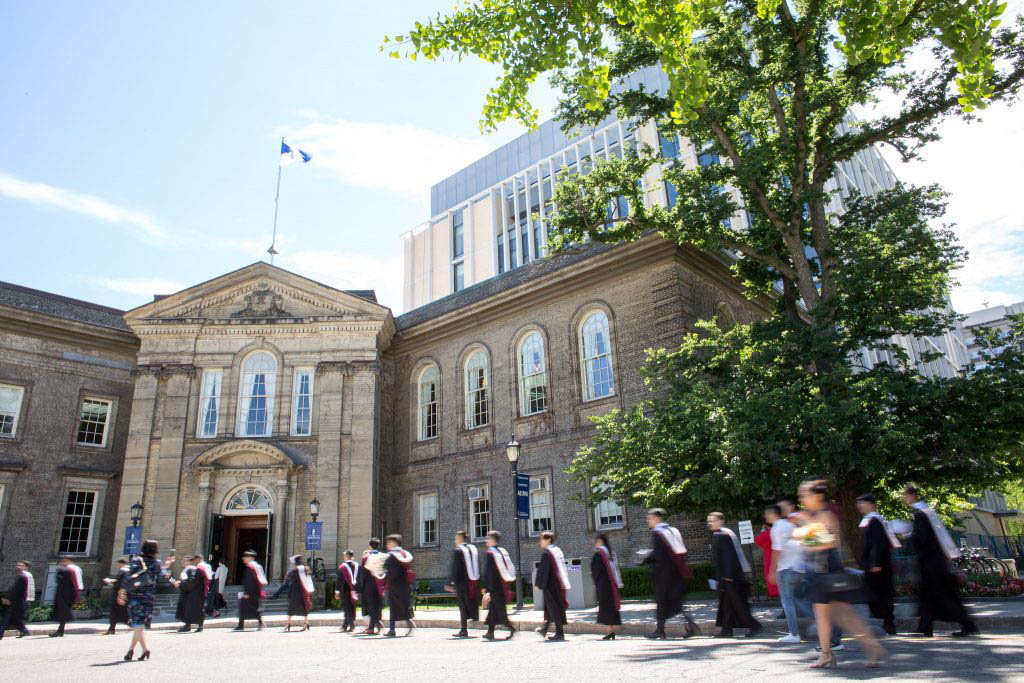
Chapter 2: Graduate Studies
Data in this chapter are presented by academic year (September to August) unless otherwise noted.
Facts & Figures
1,377
MEng students, an increase of 69.0% over the last decade.
$65.3M
Total graduate student funding, an all-time high and an increase of 46.1% over the past ten years
51
Direct-entry PhD students in 2024-2025, the highest number entering via this pathway to date (Figure 2.7b)
Figure 2.1a Domestic and International MASc Students: Applications, Offers, Registrations, Selectivity and Yield, 2015–2016 to 2024–2025
Applications and offers include those received between May and April of the listed academic year. Registrations are shown as of November 1. Selectivity = offers ÷ applications and represents the proportion of applicants who were offered admission. Yield = registration ÷ offers. Domestic students are defined as citizens (living in Canada or abroad) or permanent residents of Canada.

MASc Domestic Students
| Year | Applications | Offers | Registrations | Selectivity | Yield |
|---|---|---|---|---|---|
| 2015–16 | 598 | 265 | 221 | 0.44 | 0.83 |
| 2016–17 | 633 | 275 | 234 | 0.43 | 0.85 |
| 2017–18 | 642 | 289 | 245 | 0.45 | 0.85 |
| 2018–19 | 556 | 238 | 194 | 0.43 | 0.82 |
| 2019–20 | 548 | 232 | 204 | 0.42 | 0.88 |
| 2020–21 | 592 | 241 | 219 | 0.41 | 0.91 |
| 2021–22 | 557 | 224 | 193 | 0.40 | 0.86 |
| 2022–23 | 439 | 198 | 167 | 0.45 | 0.84 |
| 2023–24 | 405 | 215 | 186 | 0.53 | 0.87 |
| 2024–25 | 514 | 236 | 187 | 0.46 | 0.79 |
MASc International Students
| Applications | Offers | Registrations | Selectivity | Yield | |
|---|---|---|---|---|---|
| 2015–16 | 1,015 | 65 | 48 | 0.06 | 0.74 |
| 2016–17 | 1,022 | 76 | 65 | 0.07 | 0.86 |
| 2017–18 | 1,276 | 84 | 68 | 0.07 | 0.81 |
| 2018–19 | 1,263 | 98 | 82 | 0.08 | 0.84 |
| 2019–20 | 1,367 | 94 | 76 | 0.07 | 0.81 |
| 2020–21 | 1,258 | 72 | 58 | 0.06 | 0.81 |
| 2021–22 | 1,244 | 80 | 67 | 0.06 | 0.84 |
| 2022–23 | 927 | 64 | 48 | 0.07 | 0.75 |
| 2023–24 | 749 | 45 | 31 | 0.06 | 0.69 |
| 2024–25 | 532 | 47 | 36 | 0.09 | 0.77 |
Figure 2.1b Domestic and International PhD Students: Applications, Offers, Registrations, Selectivity and Yield, 2015–2016 to 2024–2025
Applications and offers include those received between May and April of the listed academic year. Registrations are shown as of November 1. Selectivity = offers ÷ applications and represents the proportion of applicants who were offered admission. Yield = registration ÷ offers. Domestic students are defined as citizens (living in Canada or abroad) or permanent residents of Canada. Students who have fast-tracked from MASc programs into PhD programs are counted in this figure as applications, offers and admissions.

PhD Domestic Students
| Year | Applications | Offers | Registrations | Selectivity | Yield |
|---|---|---|---|---|---|
| 2015–16 | 239 | 131 | 117 | 0.55 | 0.89 |
| 2016–17 | 227 | 125 | 117 | 0.55 | 0.94 |
| 2017–18 | 217 | 135 | 118 | 0.62 | 0.87 |
| 2018–19 | 271 | 152 | 145 | 0.56 | 0.95 |
| 2019–20 | 242 | 131 | 121 | 0.54 | 0.92 |
| 2020–21 | 247 | 132 | 117 | 0.53 | 0.89 |
| 2021–22 | 248 | 141 | 122 | 0.57 | 0.87 |
| 2022–23 | 235 | 150 | 129 | 0.64 | 0.86 |
| 2023–24 | 185 | 123 | 107 | 0.66 | 0.87 |
| 2024–25 | 188 | 113 | 93 | 0.60 | 0.82 |
PhD International Students
| Year | Applications | Offers | Registrations | Selectivity | Yield |
|---|---|---|---|---|---|
| 2015–16 | 614 | 85 | 66 | 0.14 | 0.78 |
| 2016–17 | 626 | 90 | 72 | 0.14 | 0.80 |
| 2017–18 | 841 | 97 | 70 | 0.12 | 0.72 |
| 2018–19 | 787 | 154 | 116 | 0.20 | 0.75 |
| 2019–20 | 887 | 191 | 158 | 0.22 | 0.83 |
| 2020–21 | 916 | 173 | 133 | 0.19 | 0.77 |
| 2021–22 | 877 | 180 | 142 | 0.21 | 0.79 |
| 2022–23 | 720 | 184 | 118 | 0.26 | 0.64 |
| 2023–24 | 731 | 226 | 145 | 0.31 | 0.64 |
| 2024–25 | 673 | 189 | 100 | 0.28 | 0.53 |
Figure 2.1c Domestic and International MEng and MHSc Students: Applications, Offers, Registrations, Selectivity and Yield, 2015–2016 to 2024–2025
Applications and offers include those received between May and April of the listed academic year. Registrations are shown as of November 1. Selectivity = offers ÷ applications and represents the proportion of applicants who were offered admission. Yield = registration ÷ offers. Domestic students are defined as citizens (living in Canada or abroad) or permanent residents of Canada.

MEng and MHSc Domestic Students
| Year | Applications | Offers | Registrations | Selectivity | Yield |
|---|---|---|---|---|---|
| 2015–16 | 794 | 461 | 311 | 0.58 | 0.67 |
| 2016–17 | 881 | 506 | 299 | 0.57 | 0.59 |
| 2017–18 | 784 | 498 | 309 | 0.64 | 0.62 |
| 2018–19 | 737 | 441 | 272 | 0.60 | 0.62 |
| 2019–20 | 739 | 388 | 236 | 0.53 | 0.61 |
| 2020–21 | 951 | 607 | 375 | 0.64 | 0.62 |
| 2021–22 | 1,041 | 617 | 333 | 0.59 | 0.54 |
| 2022–23 | 853 | 502 | 260 | 0.59 | 0.52 |
| 2023–24 | 784 | 527 | 316 | 0.67 | 0.60 |
| 2024–25 | 986 | 625 | 367 | 0.63 | 0.59 |
MEng and MHSc International Students
| Year | Applications | Offers | Registrations | Selectivity | Yield |
|---|---|---|---|---|---|
| 2015–16 | 1,171 | 429 | 223 | 0.37 | 0.52 |
| 2016–17 | 1,292 | 486 | 235 | 0.38 | 0.48 |
| 2017–18 | 1,531 | 517 | 224 | 0.34 | 0.43 |
| 2018–19 | 1,695 | 580 | 287 | 0.34 | 0.49 |
| 2019–20 | 2,019 | 739 | 335 | 0.37 | 0.45 |
| 2020–21 | 2,127 | 862 | 325 | 0.41 | 0.38 |
| 2021–22 | 2,617 | 1,109 | 468 | 0.42 | 0.42 |
| 2022–23 | 2,671 | 1,030 | 371 | 0.39 | 0.36 |
| 2023–24 | 2,616 | 1,271 | 441 | 0.49 | 0.35 |
| 2024–25 | 2,445 | 1,208 | 455 | 0.49 | 0.38 |
Figure 2.2a Graduate Students by Degree Type, 2015–2016 to 2024–2025
Student counts are shown as of November 1, 2024. The MHSc program was discontinued in 2019; from 2022, the MEng & MHSc column represents MEng students only.

Figure 2.2b Graduate Enrolment by Full-Time Equivalent (FTE) and Headcount (HC) by Academic Area, 2015–2016 to 2024–2025
Student counts are shown as of November 1, 2024. All graduate students affiliated with ISTEP are part of collaborative programs with degrees granted by one of the other graduate units; in the figures in this chapter, these students are counted under their home unit.
| Year | FTE/HC | UTIAS | BME | ChemE | CivMin | ECE | MIE | MSE | Total |
|---|---|---|---|---|---|---|---|---|---|
| 2015–16 | FTE | 143.2 | 241.0 | 253.0 | 299.4 | 591.5 | 532.9 | 79.0 | 2,140.0 |
| HC | 146 | 241 | 260 | 326 | 637 | 570 | 79 | 2,259 | |
| 2016–17 | FTE | 178.2 | 269.0 | 245.0 | 306.3 | 577.0 | 580.3 | 92.3 | 2,248.1 |
| HC | 181 | 269 | 252 | 335 | 619 | 616 | 93 | 2,365 | |
| 2017–18 | FTE | 170.1 | 296.0 | 246.7 | 313.0 | 551.5 | 602.8 | 94.9 | 2,275.0 |
| HC | 175 | 303 | 253 | 348 | 597 | 642 | 97 | 2,415 | |
| 2018–19 | FTE | 191.4 | 283.3 | 219.5 | 304.0 | 618.8 | 658.0 | 94.9 | 2,369.9 |
| HC | 197 | 291 | 223 | 332 | 658 | 700 | 97 | 2,498 | |
| 2019–20 | FTE | 226.2 | 327.1 | 235.0 | 349.9 | 630.2 | 641.8 | 95.6 | 2,505.8 |
| HC | 236 | 332 | 242 | 380 | 668 | 681 | 97 | 2,636 | |
| 2020–21 | FTE | 258.8 | 350.9 | 229.0 | 371.8 | 613.8 | 657.8 | 101.9 | 2,584.0 |
| HC | 270 | 353 | 236 | 404 | 653 | 711 | 104 | 2,731 | |
| 2021–22 | FTE | 279.6 | 360.5 | 239.0 | 396.7 | 664.0 | 812.6 | 117.2 | 2,869.6 |
| HC | 288 | 364 | 246 | 424 | 706 | 863 | 120 | 3,011 | |
| 2022–23 | FTE | 234.0 | 349.2 | 254.3 | 338.6 | 768.3 | 770.9 | 124.9 | 2,840.2 |
| HC | 241 | 352 | 262 | 361 | 825 | 829 | 127 | 2,997 | |
| 2023–24 | FTE | 223.9 | 381.6 | 248.8 | 321.2 | 783.5 | 739.5 | 104.9 | 2,803.4 |
| HC | 233 | 383 | 260 | 345 | 850 | 799 | 107 | 2,977 | |
| 2024–25 | FTE | 245.8 | 386.5 | 253.5 | 328.4 | 824.5 | 790.0 | 93.3 | 2,922.0 |
| HC | 250 | 390 | 264 | 355 | 912 | 853 | 94 | 3,118 |
Figure 2.3a PhD Enrolment by Academic Unit (Headcount), 2015–2016 to 2024–2025
Student counts are shown as of November 1, 2024.

PhD Enrolment
| Year | UTIAS | IBME | CHE | CIV | ECE | MIE | MSE | Total |
|---|---|---|---|---|---|---|---|---|
| 2015–16 | 59 | 143 | 109 | 104 | 244 | 193 | 29 | 881 |
| 2016–17 | 59 | 151 | 108 | 112 | 222 | 189 | 36 | 877 |
| 2017–18 | 61 | 155 | 102 | 99 | 208 | 185 | 36 | 846 |
| 2018–19 | 70 | 154 | 105 | 111 | 234 | 198 | 39 | 911 |
| 2019–20 | 78 | 186 | 104 | 126 | 263 | 204 | 49 | 1010 |
| 2020–21 | 89 | 193 | 118 | 132 | 288 | 206 | 55 | 1081 |
| 2021–22 | 107 | 219 | 119 | 146 | 307 | 256 | 56 | 1210 |
| 2022–23 | 102 | 227 | 125 | 159 | 314 | 276 | 56 | 1259 |
| 2023–24 | 106 | 235 | 127 | 161 | 297 | 288 | 55 | 1269 |
| 2024–25 | 106 | 228 | 130 | 158 | 284 | 281 | 56 | 1243 |
Figure 2.3b MASc Enrolment by Academic Unit (Headcount), 2015–2016 to 2024–2025
Student counts are shown as of November 1, 2024.

MASc Enrolment
| Year | UTIAS | IBME | CHE | CIV | ECE | MIE | MSE | Total |
|---|---|---|---|---|---|---|---|---|
| 2015–16 | 51 | 57 | 72 | 96 | 149 | 110 | 28 | 563 |
| 2016–17 | 74 | 66 | 70 | 98 | 151 | 121 | 28 | 608 |
| 2017–18 | 69 | 92 | 72 | 89 | 181 | 138 | 29 | 670 |
| 2018–19 | 75 | 83 | 66 | 93 | 198 | 134 | 27 | 676 |
| 2019–20 | 71 | 78 | 59 | 92 | 169 | 146 | 20 | 635 |
| 2020–21 | 68 | 96 | 46 | 88 | 171 | 162 | 22 | 653 |
| 2021–22 | 73 | 91 | 41 | 86 | 164 | 140 | 25 | 620 |
| 2022–23 | 62 | 74 | 34 | 61 | 166 | 113 | 30 | 540 |
| 2023–24 | 64 | 77 | 35 | 50 | 159 | 98 | 18 | 501 |
| 2024–25 | 74 | 89 | 38 | 50 | 139 | 99 | 9 | 498 |
Figure 2.3c MEng/MHSc Enrolment by Academic Unit (Headcount), 2015–2016 to 2024–2025
Student counts are shown as of November 1, 2024.

MEng & MHSc Enrolment
| Year | UTIAS | IBME | CHE | CIV | ECE | MIE | MSE | Total |
|---|---|---|---|---|---|---|---|---|
| 2015–16 | 36 | 41 | 79 | 126 | 244 | 267 | 22 | 815 |
| 2016–17 | 48 | 52 | 74 | 125 | 246 | 306 | 29 | 880 |
| 2017–18 | 45 | 56 | 79 | 160 | 208 | 319 | 32 | 899 |
| 2018–19 | 52 | 54 | 52 | 128 | 226 | 368 | 31 | 911 |
| 2019–20 | 87 | 68 | 79 | 162 | 236 | 331 | 28 | 991 |
| 2020–21 | 113 | 64 | 72 | 184 | 194 | 343 | 27 | 997 |
| 2021–22 | 108 | 54 | 86 | 192 | 235 | 467 | 39 | 1181 |
| 2022–23 | 77 | 51 | 103 | 141 | 345 | 440 | 41 | 1198 |
| 2023–24 | 63 | 71 | 98 | 134 | 394 | 413 | 34 | 1207 |
| 2024–25 | 70 | 73 | 96 | 147 | 489 | 473 | 29 | 1377 |
Figure 2.4a Graduate and Undergraduate FTE Student-to-Faculty Ratios, 2015–2016 to 2024–2025
To allow more accurate comparisons, undergraduate FTEs are determined by counting each part-time student as 0.3 FTE. The MHSc program was discontinued in 2019; from 2022, the MEng & MHSc column represents MEng students only.

Figure 2.4b FTE Graduate Student-to-Faculty Ratios by Academic Area and Degree Type, 2024–2025
The MHSc program was discontinued in 2019; from 2022, the MEng & MHSc column represents MEng students only. Some students in BME are supervised by faculty members from the Faculties of Medicine and Dentistry and affiliated hospitals, as well as from other departments within U of T Engineering. Because the ratio includes only faculty with a budgetary appointment in BME, comparisons with other Engineering departments are not possible. For that reason, this figure shows BME in a visually distinct way. In cases of inter-departmental supervision within the Faculty, PhD and MASc students are assigned 100% to their primary supervisor’s department. All graduate students affiliated with ISTEP are part of collaborative programs with degrees granted by one of the other graduate units; in the figures in this chapter, these students are counted under their home unit.

Figure 2.5a Graduate Student Funding by Category, 2014–2015 to 2023–2024
For graduate student funding figures, a slip year is used to include funding received during the summer term.

Figure 2.5b Graduate Student Funding by Category and Academic Area, 2023–2024
For graduate student funding figures, a slip year is used to include funding received during the summer term. All graduate students affiliated with ISTEP are part of collaborative programs with degrees granted by one of the other graduate units; in the figures in this chapter, these students are counted under their home unit.

Figure 2.6a Total External Graduate Student Scholarships by Source, 2014–2015 to 2023–2024
For graduate student funding figures, a slip year is used to include funding received during the summer term.
| Year | NSERC and CIHR | OGS | Other | Internal | Total |
|---|---|---|---|---|---|
| 2014–15 | $3,975,701 | $1,336,670 | $403,762 | $4,492,771 | $10,208,904 |
| 2015–16 | $3,875,675 | $1,223,331 | $366,335 | $4,818,839 | $10,284,180 |
| 2016–17 | $3,539,878 | $1,360,004 | $333,919 | $5,237,213 | $10,471,014 |
| 2017–18 | $3,259,319 | $1,525,000 | $286,908 | $4,571,797 | $9,643,024 |
| 2018–19 | $3,390,489 | $1,443,333 | $508,399 | $4,986,623 | $10,328,844 |
| 2019–20 | $3,593,330 | $1,491,670 | $490,855 | $4,787,185 | $10,363,040 |
| 2020–21 | $3,818,085 | $1,418,336 | $543,783 | $5,342,620 | $11,122,825 |
| 2021–22 | $3,318,493 | $1,523,329 | $323,674 | $5,307,266 | $10,472,762 |
| 2022–23 | $3,295,840 | $1,570,011 | $227,967 | $5,981,726 | $11,075,544 |
| 2023–24 | $3,152,493 | $1,544,999 | $198,162 | $6,464,244 | $11,359,897 |
Figure 2.6b Number of NSERC and CIHR Graduate Student Award Recipients by Academic Area, 2014–2015 to 2023–2024
For graduate student funding figures, a slip year is used to include funding received during the summer term. All graduate students affiliated with ISTEP are part of collaborative programs with degrees granted by one of the other graduate units; in the figures in this chapter, these students are counted under their home unit.

Figure 2.7a Number of Students Fast-Tracked from Masters to PhD by Academic Area, 2015–2016 to 2024–2025
For counting purposes, the academic year is from May to April. All graduate students affiliated with ISTEP are part of collaborative programs with degrees granted by one of the other graduate units; in the figures in this chapter, these students are counted under their home unit.
| Year | UTIAS | BME | ChemE | CivMin | ECE | MIE | MSE | Total |
|---|---|---|---|---|---|---|---|---|
| 2015–16 | 1 | 14 | 5 | 5 | 4 | 8 | 2 | 39 |
| 2016–17 | 3 | 8 | 7 | 5 | 3 | 13 | 2 | 41 |
| 2017–18 | 10 | 11 | 5 | 7 | 6 | 6 | 0 | 45 |
| 2018–19 | 5 | 15 | 6 | 3 | 14 | 3 | 0 | 46 |
| 2019–20 | 6 | 4 | 6 | 2 | 11 | 3 | 2 | 34 |
| 2020–21 | 9 | 11 | 7 | 4 | 12 | 7 | 0 | 50 |
| 2021–22 | 11 | 7 | 3 | 3 | 13 | 13 | 3 | 53 |
| 2022–23 | 8 | 15 | 5 | 8 | 5 | 12 | 2 | 55 |
| 2023–24 | 5 | 4 | 4 | 1 | 7 | 11 | 4 | 36 |
| 2024–25 | 2 | 9 | 2 | 0 | 4 | 4 | 1 | 22 |
Figure 2.7b Number of Direct-Entry PhD students by Academic Area, 2015–2016 to 2024–2025
For counting purposes, the academic year is from May to April. All graduate students affiliated with ISTEP are part of collaborative programs with degrees granted by one of the other graduate units; in the figures in this chapter, these students are counted under their home unit.
| Year | UTIAS | BME | ChemE | CivMin | ECE | MIE | MSE | Total |
|---|---|---|---|---|---|---|---|---|
| 2015–16 | 0 | 5 | 5 | 0 | 2 | 0 | 0 | 12 |
| 2016–17 | 0 | 7 | 1 | 1 | 2 | 4 | 0 | 15 |
| 2017–18 | 0 | 11 | 0 | 0 | 2 | 0 | 0 | 13 |
| 2018–19 | 0 | 9 | 12 | 2 | 2 | 2 | 0 | 27 |
| 2019–20 | 2 | 21 | 7 | 4 | 4 | 3 | 0 | 41 |
| 2020–21 | 1 | 23 | 6 | 2 | 3 | 2 | 5 | 42 |
| 2021–22 | 0 | 19 | 7 | 3 | 3 | 2 | 3 | 37 |
| 2022–23 | 1 | 15 | 6 | 3 | 2 | 5 | 5 | 37 |
| 2023–24 | 1 | 20 | 7 | 4 | 6 | 9 | 3 | 50 |
| 2024–25 | 0 | 17 | 9 | 4 | 10 | 10 | 1 | 51 |
Figure 2.8a Time to Completion for PhD, MASc, MEng and MHSc Students, 2015–2016 to 2024–2025
The MHSc program admitted its last students in 2019.
| Year | PhD | MASc | MEng & MHSc (FT) | MEng (ExtFT) | MEng (PT) |
|---|---|---|---|---|---|
| 2015–16 | 5.3 | 2 | 1 | 1.7 | 2 |
| 2016–17 | 5.3 | 2 | 1 | 1.7 | 2.3 |
| 2017–18 | 5 | 2 | 1 | 1.7 | 2 |
| 2018–19 | 5.3 | 2 | 1 | 1.7 | 2 |
| 2019–20 | 5 | 2 | 1 | 1.7 | 2 |
| 2020–21 | 5.3 | 2 | 1 | 1.7 | 2 |
| 2021–22 | 5.3 | 2 | 1 | 1.7 | 2 |
| 2022–23 | 5 | 2 | 1 | 1.7 | 2 |
| 2023–24 | 5.3 | 2 | 1 | 1.7 | 2 |
| 2024–25 | 5.33 | 2 | 1 | 1.67 | 2 |
Figure 2.8b Time to Completion for Graduate Students – University of Toronto Institute for Aerospace Studies, 2015–2016 to 2024–2025
| Year | PhD | MASc | MEng (FT) | MEng (Ext FT) | MEng (PT) |
|---|---|---|---|---|---|
| 2015–16 | 6.3 | 2.0 | 1.0 | 1.7 | 2.3 |
| 2016–17 | 5.3 | 2.0 | 1.0 | 1.7 | 3.0 |
| 2017–18 | 5.0 | 2.0 | 1.0 | 1.7 | 3.0 |
| 2018–19 | 5.8 | 2.0 | 1.0 | 1.7 | |
| 2019–20 | 6.0 | 2.0 | 1.0 | 1.7 | 2.3 |
| 2020–21 | 5.7 | 2.0 | 1.0 | 1.7 | 2.0 |
| 2021–22 | 6.0 | 2.0 | 1.0 | 1.7 | 2.2 |
| 2022–23 | 5.8 | 2.0 | 1.0 | 1.7 | 2.0 |
| 2023–24 | 6.8 | 2.0 | 1.0 | 1.7 | 2.2 |
| 2024–25 | 6.3 | 2.0 | 1.0 | 1.7 | 3.0 |
Figure 2.8c Time to Completion for Graduate Students – Institute of Biomedical Engineering, 2015–2016 to 2024–2025
The MHSc program admitted its last students in 2019.
| Year | PhD | MASc | MEng (FT) | MEng (Ext FT) | MEng (PT) | MHSc (FT) |
|---|---|---|---|---|---|---|
| 2015–16 | 5.7 | 2.0 | 2.0 | |||
| 2016–17 | 5.2 | 2.0 | 2.0 | |||
| 2017–18 | 5.3 | 2.3 | 1.0 | 2.0 | ||
| 2018–19 | 5.5 | 2.0 | 1.0 | 1.3 | 2.0 | |
| 2019–20 | 6.0 | 2.0 | 1.0 | 1.7 | 2.0 | |
| 2020–21 | 6.0 | 2.3 | 1.0 | 1.7 | 2.0 | |
| 2021–22 | 5.7 | 2.0 | 1.0 | 1.3 | 2.3 | |
| 2022–23 | 6.0 | 2.2 | 1.0 | 1.7 | 1.3 | |
| 2023–24 | 6.0 | 2.0 | 1.0 | 1.7 | 1.7 | |
| 2024–25 | 5.3 | 2.0 | 1.0 | 1.7 | 1.7 |
Figure 2.8d Time to Completion for Graduate Students – Department of Chemical Engineering & Applied Chemistry, 2015–2016 to 2024–2025
| Year | PhD | MASc | MEng (FT) | MEng (Ext FT) | MEng (PT) |
|---|---|---|---|---|---|
| 2015–16 | 5.7 | 2.3 | 1.0 | 1.7 | 1.5 |
| 2016–17 | 5.5 | 2.0 | 1.0 | 1.7 | 2.0 |
| 2017–18 | 5.8 | 2.0 | 1.0 | 1.7 | 1.7 |
| 2018–19 | 5.5 | 2.0 | 1.0 | 1.7 | 1.7 |
| 2019–20 | 6.3 | 2.0 | 1.0 | 1.8 | 0.0 |
| 2020–21 | 5.3 | 2.3 | 1.0 | 1.7 | 2.0 |
| 2021–22 | 5.0 | 2.3 | 1.0 | 2.0 | 3.0 |
| 2022–23 | 5.3 | 2.3 | 1.0 | 1.7 | 1.8 |
| 2023–24 | 5.3 | 2.0 | 1.0 | 1.7 | 2.0 |
| 2024–25 | 6.0 | 2.0 | 1.0 | 1.7 | 1.7 |
Figure 2.8e Time to Completion for Graduate Students – Department of Civil & Mineral Engineering, 2015–2016 to 2024–2025
| Year | PhD | MASc | MEng (FT) | MEng (Ext FT) | MEng (PT) | MEngCEM (FT) | MEngCEM (Ext FT) |
|---|---|---|---|---|---|---|---|
| 2015–16 | 5.3 | 2.0 | 1.0 | 1.7 | 2.0 | 1.3 | |
| 2016–17 | 5.7 | 2.0 | 1.0 | 1.3 | 2.2 | 1.3 | |
| 2017–18 | 5.0 | 2.0 | 1.0 | 1.3 | 2.0 | 1.3 | 1.3 |
| 2018–19 | 5.2 | 2.0 | 1.0 | 1.3 | 1.7 | 1.3 | 1.5 |
| 2019–20 | 4.3 | 2.0 | 1.0 | 1.3 | 2.3 | 1.3 | 1.7 |
| 2020–21 | 5.3 | 2.0 | 1.0 | 1.3 | 2.2 | 1.3 | |
| 2021–22 | 5.7 | 2.0 | 1.0 | 1.5 | 2.0 | 1.0 | 1.7 |
| 2022–23 | 5.3 | 2.0 | 1.0 | 1.3 | 2.0 | 1.0 | 1.5 |
| 2023–24 | 5.7 | 2.0 | 1.0 | 1.5 | 2.3 | 1.0 | 1.3 |
| 2024–25 | 5.7 | 2.0 | 1.0 | 1.3 | 2.3 | 1.0 | 1.5 |
Figure 2.8f Time to Completion for Graduate Students – The Edward S. Rogers Sr. Department of Electrical & Computer Engineering, 2015–2016 to 2024–2025
| Year | PhD | MASc | MEng (FT) | MEng (Ext FT) | MEng (PT) |
|---|---|---|---|---|---|
| 2015–16 | 5.0 | 2.0 | 1.0 | 1.3 | 2.0 |
| 2016–17 | 5.3 | 2.0 | 1.0 | 1.3 | 2.3 |
| 2017–18 | 5.0 | 2.3 | 1.0 | 1.7 | 2.7 |
| 2018–19 | 5.3 | 2.3 | 1.0 | 1.3 | 2.3 |
| 2019–20 | 5.0 | 2.0 | 1.0 | 1.3 | 2.3 |
| 2020–21 | 5.5 | 2.3 | 1.0 | 1.7 | 2.3 |
| 2021–22 | 5.7 | 2.0 | 1.0 | 1.3 | 2.3 |
| 2022–23 | 5.0 | 2.0 | 1.0 | 1.7 | 2.3 |
| 2023–24 | 5.3 | 2.0 | 1.0 | 1.7 | 2.3 |
| 2024–25 | 5.3 | 2.0 | 1.0 | 1.5 | 2.0 |
Figure 2.8g Time to Completion for Graduate Students – Department of Mechanical & Industrial Engineering, 2015–2016 to 2024–2025
| Year | PhD | MASc | MEng (FT) | MEng (Ext FT) | MEng (PT) | MEngDM (PT) |
|---|---|---|---|---|---|---|
| 2015–16 | 5.0 | 2.0 | 1.0 | 1.7 | 1.7 | 3.5 |
| 2016–17 | 4.7 | 2.0 | 1.0 | 1.7 | 2.3 | 2.8 |
| 2017–18 | 5.0 | 2.0 | 1.0 | 1.7 | 2.0 | 3.0 |
| 2018–19 | 4.7 | 2.0 | 1.0 | 1.7 | 1.7 | |
| 2019–20 | 4.3 | 2.0 | 1.0 | 1.7 | 1.7 | |
| 2020–21 | 5.0 | 2.0 | 1.0 | 1.7 | 2.0 | |
| 2021–22 | 4.8 | 2.0 | 1.0 | 1.7 | 2.0 | |
| 2022–23 | 4.7 | 2.0 | 1.0 | 1.7 | 2.0 | |
| 2023–24 | 5.0 | 2.0 | 1.0 | 1.7 | 2.0 | |
| 2024–25 | 5.0 | 2.0 | 1.0 | 1.7 | 2.0 |
Figure 2.8h Time to Completion for Graduate Students – Department of Materials Science & Engineering, 2015–2016 to 2024–2025
| Year | PhD | MASc | MEng (FT) | MEng (Ext FT) | MEng (PT) |
|---|---|---|---|---|---|
| 2015–16 | 5.5 | 2.0 | 1.0 | 1.7 | |
| 2016–17 | 5.8 | 2.0 | 1.0 | 1.7 | |
| 2017–18 | 5.3 | 2.0 | 1.0 | 1.7 | |
| 2018–19 | 5.3 | 2.0 | 1.0 | 1.7 | 2.0 |
| 2019–20 | 7.0 | 2.3 | 1.0 | 1.7 | |
| 2020–21 | 4.7 | 2.5 | 1.0 | 1.8 | |
| 2021–22 | 5.3 | 2.5 | 1.0 | 2.0 | |
| 2022–23 | 4.3 | 2.8 | 1.0 | 1.7 | 2.0 |
| 2023–24 | 5.0 | 2.0 | 1.0 | 1.3 | 3.5 |
| 2024–25 | 5.0 | 2.0 | 1.0 | 2.0 |
Figure 2.9 Graduate Degrees Awarded by Degree Type, 2015–2016 to 2024–2025

Figure 2.10 New Graduate Courses Approved, 2024–2025
| Course Code | Course Title |
|---|---|
| AER 1405 | Metamaterials for Aerospace Applications |
| APS 1090 | Risk Engineering |
| BME 1455 | Microfluidics for Bioanalytical Research |
| BME 1530 | Robot Foundations & Programming for Biomedical Applications |
| CHE 1149 | Chemical Engineering Data Organization |
| CIV 1251 | Introduction to Corrosion |
| CIV 1284 | Introduction to Construction Claims |
| CIV 1287 | Construction Virtualization and Analytics |
| CIV 1410 | Rock Engineering Design Practice |
| CIV 1507 | Analytics for Transit & Mobility Systems |
| ECE1257H | Integral Equation Methods for Computational Electromagnetism |
| JEM 1068 | Semiconductor Fabrication and Inspection |
| MIE 1630 | Reinforcement Learning for Research |
| MIE 1632 | Symbolic AI Methods for Combinatorial Optimization |
| MSE 1003 | Advanced AI for Accelerated Materials Discovery |
| MSE 1059 | Synthesis of Nanostructured Materials |
| MSE 1070 | Biomedical and Clinical Devices |
| TEP 1440 | To Engineer is Human: Human Interaction Dynamics and Social Context in Engineering Work |
| TEP 1701 | Navigating Engineering Workplaces |