By the Numbers 2023
Explore comprehensive visual data about the Faculty in this companion piece to our 2023 Impact Report
Chapter 1: Undergraduate Studies
Facts & Figures
13,454
Applications for Fall 2022 undergraduate admission, the highest in our history
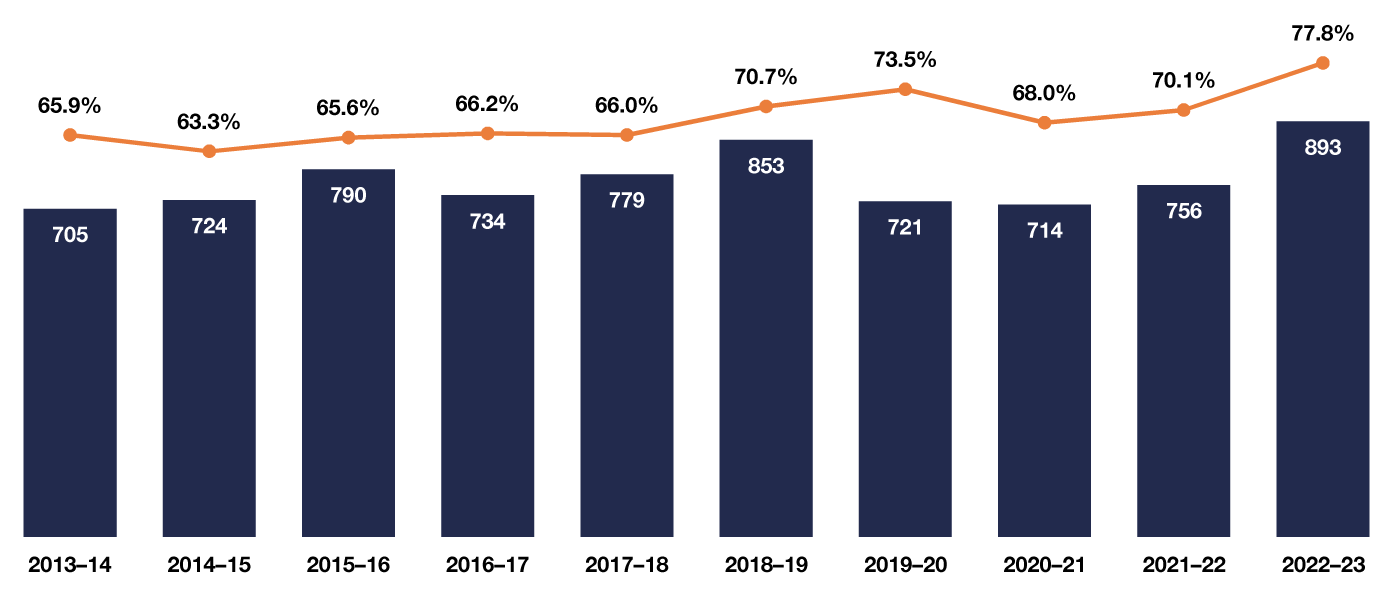
893
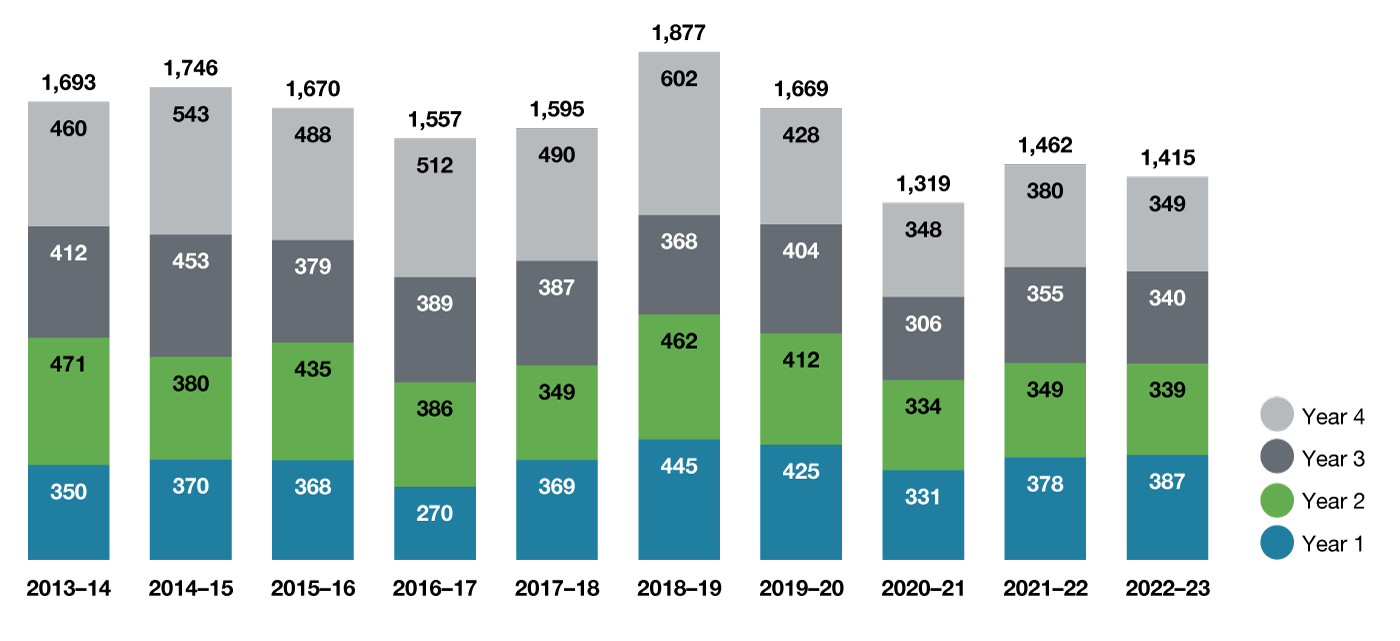
Students who participated in PEY Co-op, representing 77.8% of those eligible
740
Students who completed at least one minor or certificate, comprising 76.0% of the graduating class.
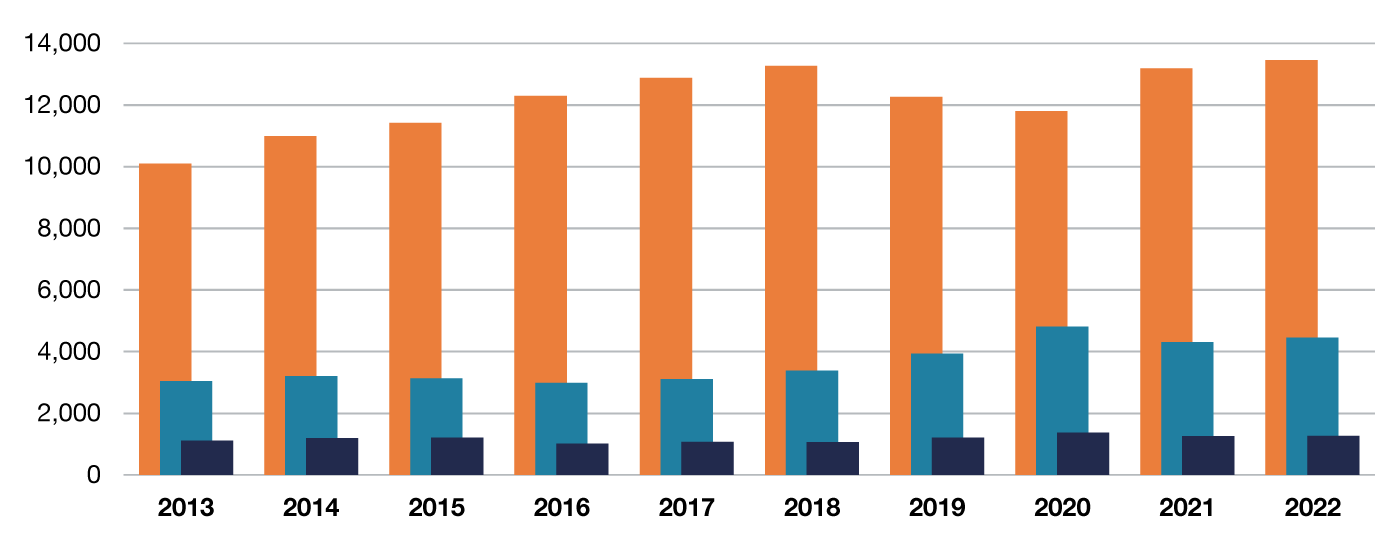
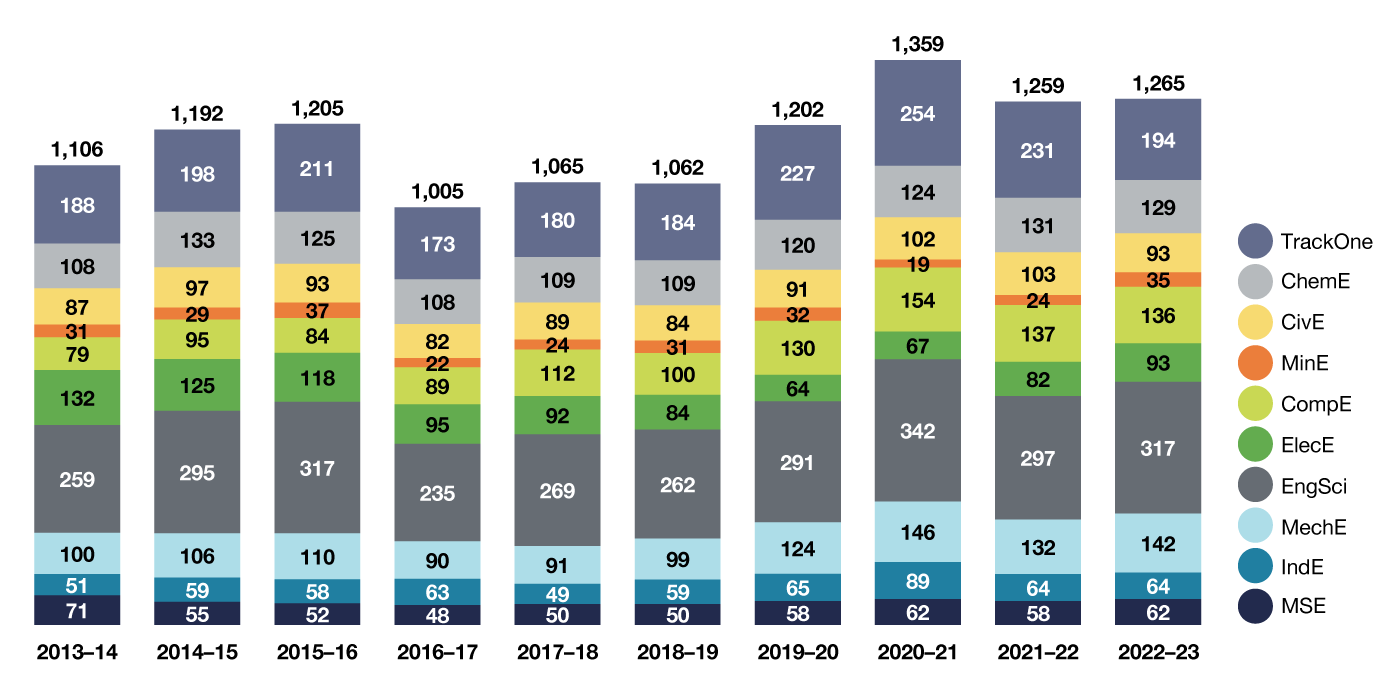
Figure 1.1a Applications, Offers, Registrations, Selectivity and Yield of First-Year Undergraduates, 2013 to 2022
Student registration counts are shown as of November 1. Applications and offers are for the fall admissions cycle. Selectivity = offers ÷ applications and represents the proportion of applicants who were offered admission. Yield = registration ÷ offers. Domestic students are defined as citizens (living in Canada or abroad) or permanent residents of Canada.
| Year | Applications | Offers | Registrations | Selectivity | Yield |
|---|---|---|---|---|---|
| 2013 | 10,095 | 3,042 | 1,106 | 0.30 | 0.36 |
| 2014 | 10,989 | 3,205 | 1,192 | 0.29 | 0.37 |
| 2015 | 11,418 | 3,126 | 1,205 | 0.27 | 0.39 |
| 2016 | 12,298 | 2,983 | 1,005 | 0.24 | 0.34 |
| 2017 | 12,880 | 3,109 | 1,065 | 0.24 | 0.34 |
| 2018 | 13,272 | 3,380 | 1,062 | 0.25 | 0.31 |
| 2019 | 12,263 | 3,937 | 1,202 | 0.32 | 0.31 |
| 2020 | 11,807 | 4,806 | 1,359 | 0.41 | 0.28 |
| 2021 | 13,188 | 4,298 | 1,259 | 0.33 | 0.29 |
| 2022 | 13,454 | 4,448 | 1,265 | 0.33 | 0.28 |
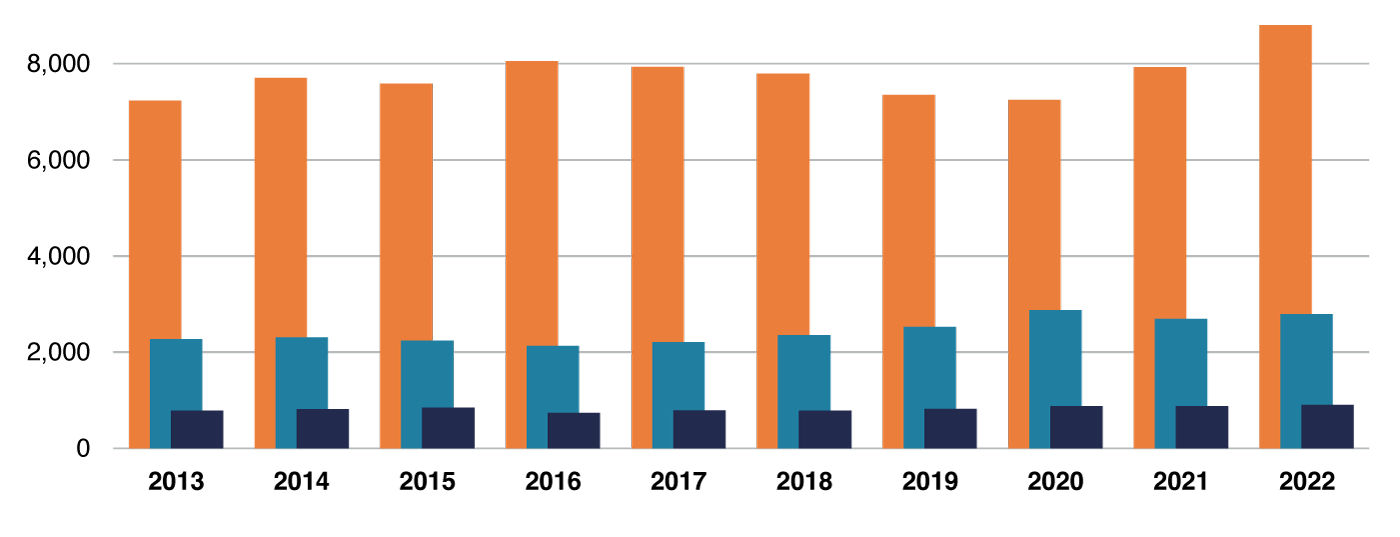
Figure 1.1b Applications, Offers, Registrations, Selectivity and Yield of Domestic First-Year Undergraduates, 2013 to 2022
Student registration counts are shown as of November 1. Applications and offers are for the fall admissions cycle. Selectivity = offers ÷ applications and represents the proportion of applicants who were offered admission. Yield = registration ÷ offers. Domestic students are defined as citizens (living in Canada or abroad) or permanent residents of Canada.
| Year | Applications | Offers | Registrations | Selectivity | Yield |
|---|---|---|---|---|---|
| 2013 | 7,229 | 2,272 | 782 | 0.31 | 0.34 |
| 2014 | 7,705 | 2,304 | 812 | 0.3 | 0.35 |
| 2015 | 7,588 | 2,239 | 843 | 0.3 | 0.38 |
| 2016 | 8,053 | 2,128 | 734 | 0.26 | 0.34 |
| 2017 | 7,933 | 2,206 | 788 | 0.28 | 0.36 |
| 2018 | 7,791 | 2,350 | 780 | 0.3 | 0.33 |
| 2019 | 7,351 | 2,526 | 821 | 0.34 | 0.33 |
| 2020 | 7,243 | 2,873 | 874 | 0.4 | 0.3 |
| 2021 | 7,927 | 2,697 | 880 | 0.34 | 0.33 |
| 2022 | 8,803 | 2,787 | 899 | 0.32 | 0.32 |
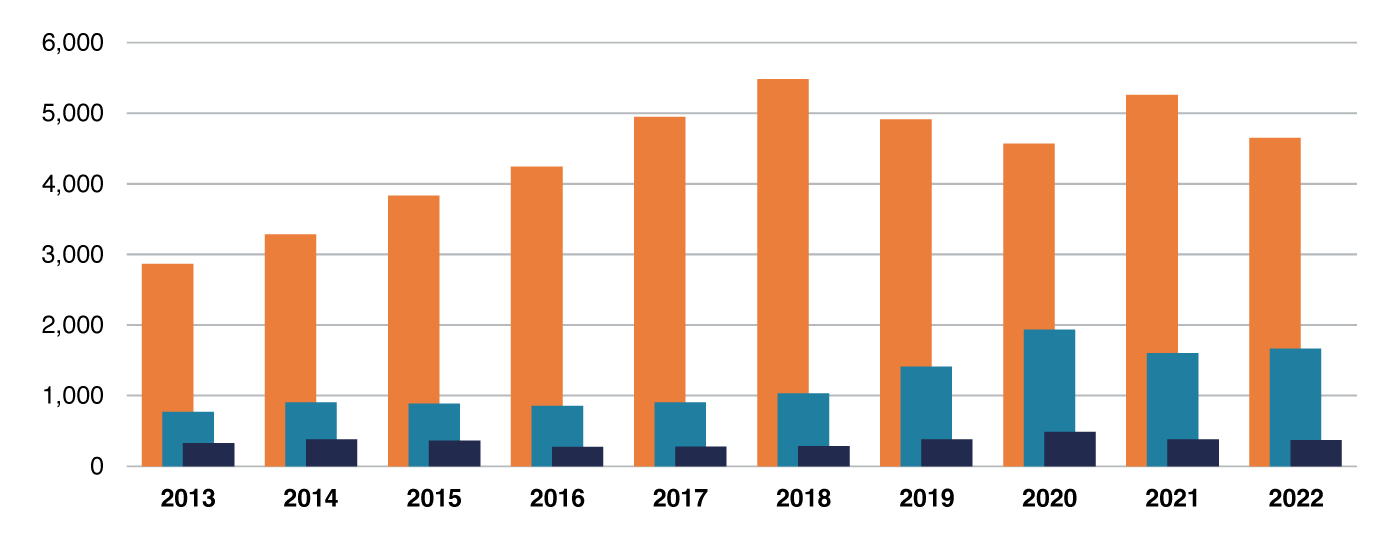
Figure 1.1c Applications, Offers, Registrations, Selectivity and Yield of International First-Year Undergraduates, 2013 to 2022
Student registration counts are shown as of November 1. Applications and offers are for the fall admissions cycle. Selectivity = offers ÷ applications and represents the proportion of applicants who were offered admission. Yield = registration ÷ offers. Domestic students are defined as citizens (living in Canada or abroad) or permanent residents of Canada.
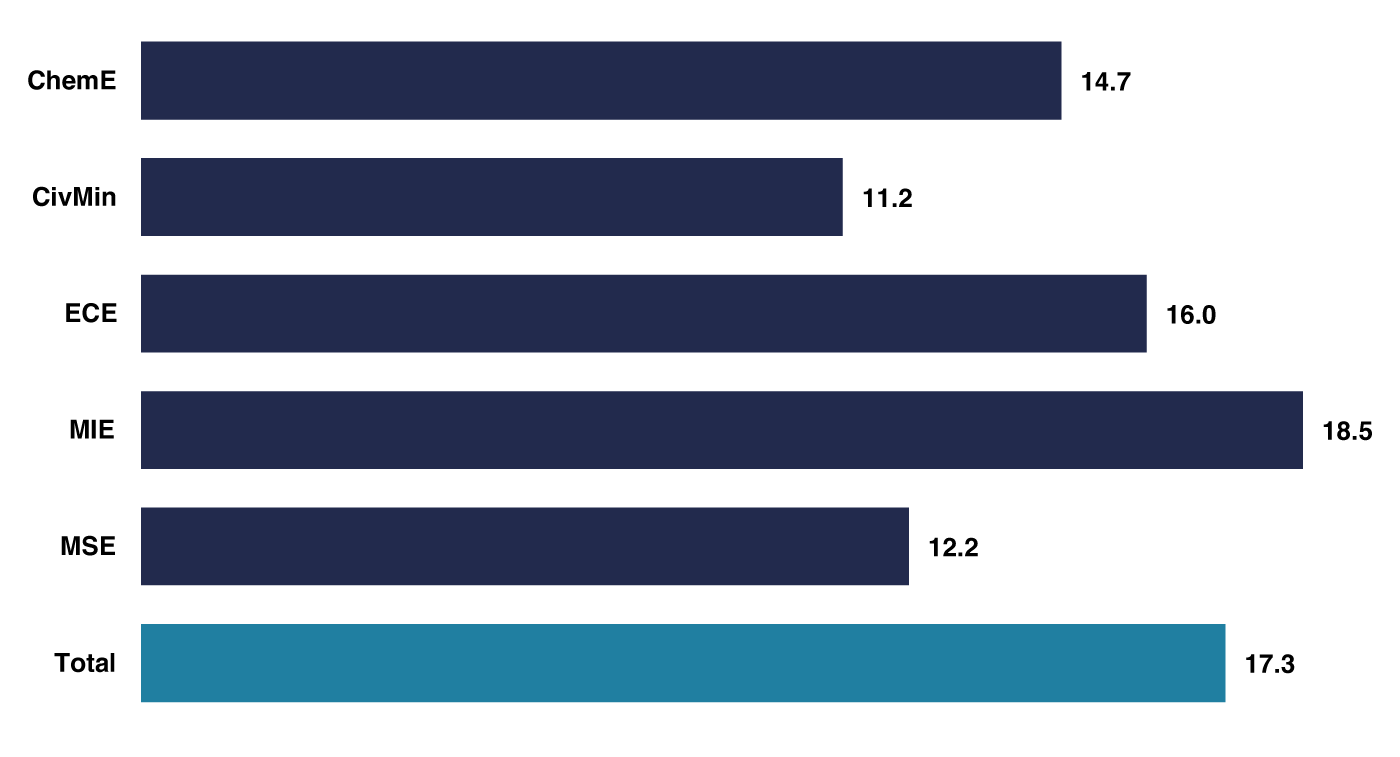
Figure 1.5a Undergraduate Student-to-Faculty Ratios by Academic Area, 2022–2023
Student and faculty counts are shown as of November 1, 2022. For full-time equivalency (FTE), each part-time student is counted as 0.3 FTE. Students with special (non-degree) status or on PEY Co-op are not included. Faculty counts include tenure-stream and teaching-stream faculty.
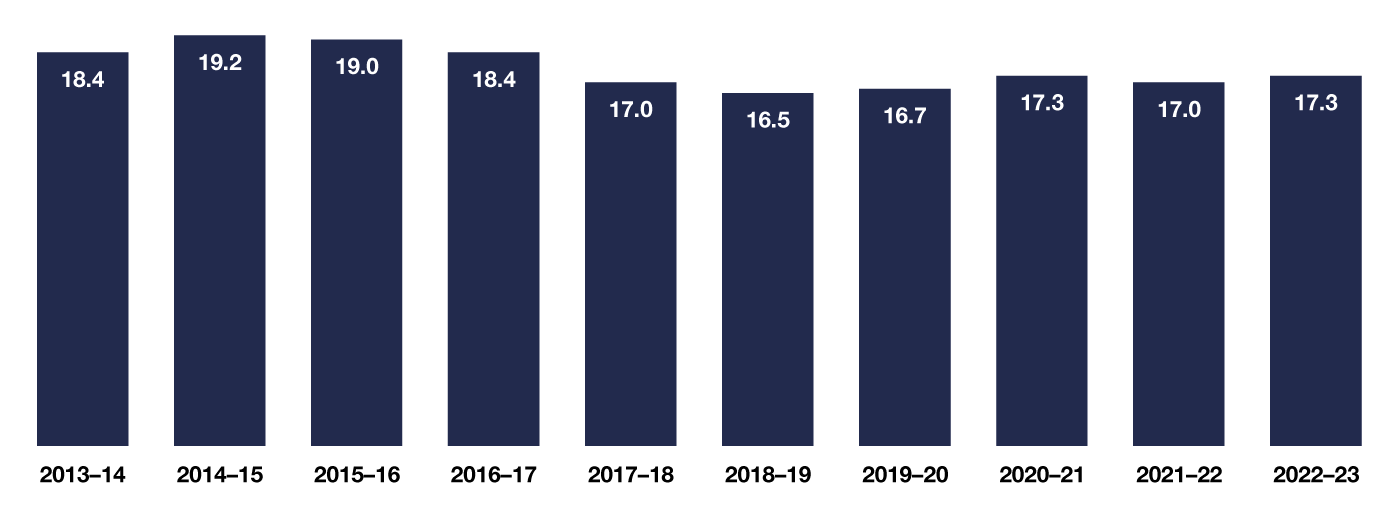
Figure 1.5b Undergraduate Full-Time Equivalent Student-Faculty Ratios, 2013–2014 to 2022–2023
Student and faculty counts are shown as of November 1, 2022. For full-time equivalency (FTE), each part-time student is counted as 0.3 FTE. Students with special (non-degree) status or on PEY Co-op are not included. Faculty counts include tenure-stream and teaching-stream faculty.
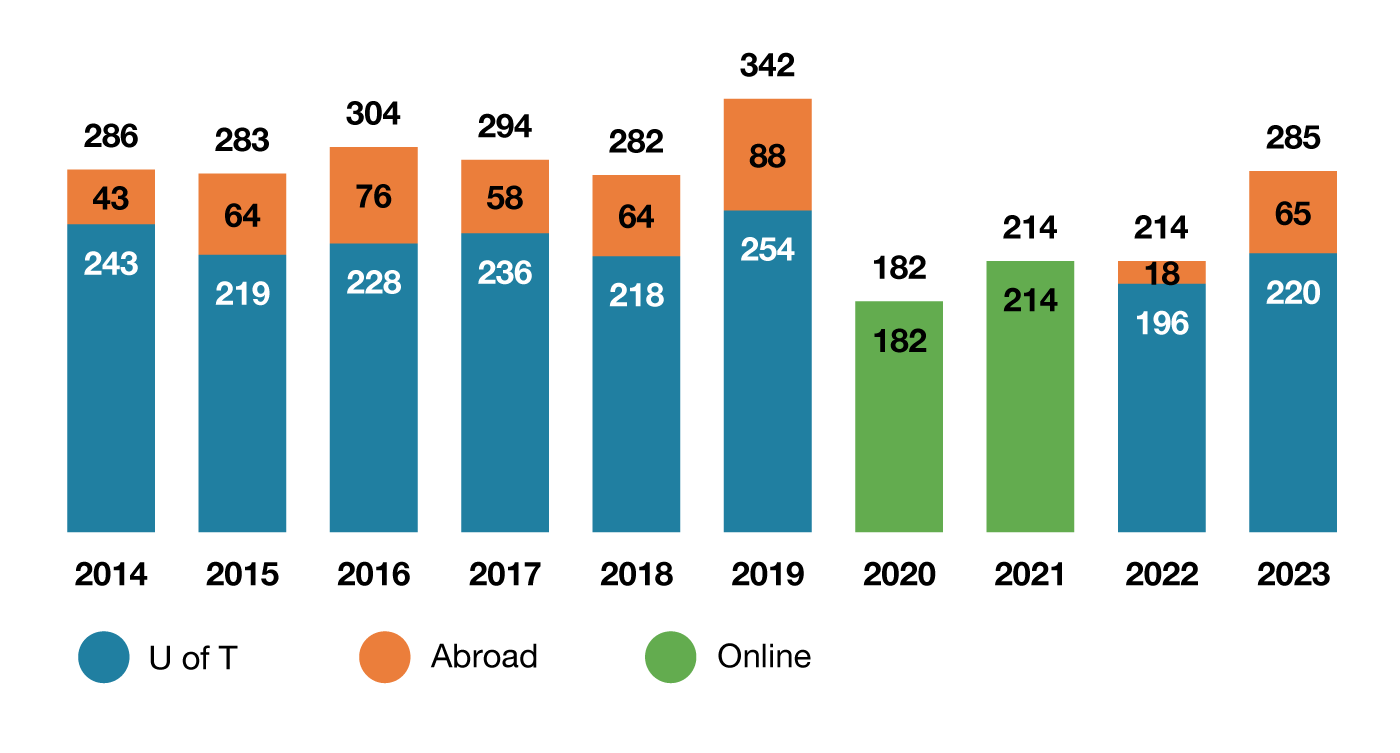
Figure 1.6b Undergraduate Participation in Summer Research Opportunities by Academic Area, 2023
| Research Participation: | U of T | Abroad | Total |
|---|---|---|---|
| ChemE | 28 | 4 | 32 |
| CivE & MinE | 24 | 24 | |
| ECE | 46 | 8 | 54 |
| EngSci | 73 | 43 | 116 |
| MIE | 38 | 7 | 45 |
| MSE | 11 | 3 | 14 |
| Total | 220 | 65 | 285 |
Figure 1.7a Number of Engineering Undergraduate Students Participating in PEY Co-op with Percentage Participation, 2013–2014 to 2022–2023
Percentage participation is calculated by dividing the number of completed PEY Co-op positions by the number of eligible students (i.e. the third-year cohort from the previous year).
Figure 1.7b Number of Canadian and International PEY Co-op Positions, 2013–2014 to 2022–2023
For 2020–2021 and 2021–2022, students’ ability to participate in U.S.-based PEY Co-op positions was limited by pandemic-related travel restrictions. Some U.S. companies responded by making offers through their Canadian offices, which were recorded as Canadian positions.
| Year | Canadian Positions | U.S. Positions | Other International Positions | Total Positions |
|---|---|---|---|---|
| 2013–2014 | 644 | 36 | 25 | 705 |
| 2014–2015 | 663 | 42 | 19 | 724 |
| 2015–2016 | 711 | 50 | 29 | 790 |
| 2016–2017 | 669 | 49 | 16 | 734 |
| 2017–2018 | 713 | 48 | 18 | 779 |
| 2018–2019 | 768 | 64 | 21 | 853 |
| 2019–2020 | 673 | 37 | 11 | 721 |
| 2020–2021 | 672 | 22 | 20 | 714 |
| 2021–2022 | 714 | 10 | 32 | 756 |
| 2022–2023 | 866 | 20 | 7 | 893 |
Figure 1.7c Number of PEY Co-op Employers, 2013–2014 to 2022–2023
| Year | PEY Co-op Employers who Hired Engineering Students |
|---|---|
| 2013–2014 | 304 |
| 2014–2015 | 317 |
| 2015–2016 | 310 |
| 2016–2017 | 337 |
| 2017–2018 | 318 |
| 2018–2019 | 368 |
| 2019–2020 | 357 |
| 2020–2021 | 310 |
| 2021–2022 | 361 |
| 2022–2023 | 410 |
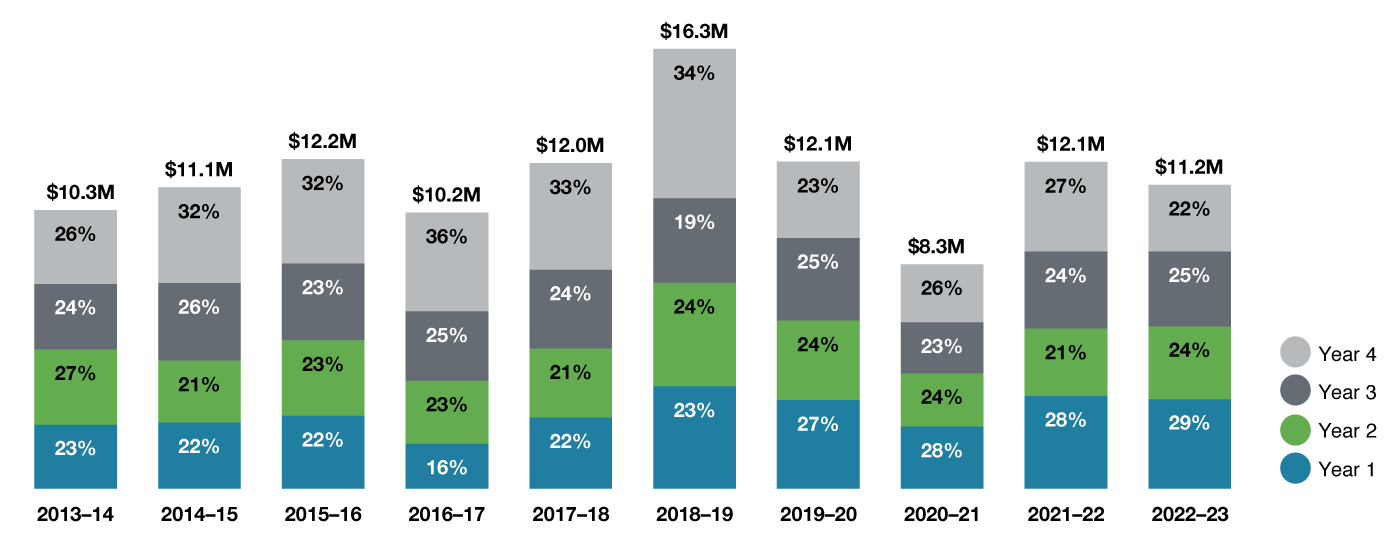
Figure 1.8b Total Value of Undergraduate Financial Assistance and Percentage Distributed by Year of Study, 2013–2014 to 2022–2023
Data comes from the Student Accounts Reporting Cube
| Year 1 | Year 2 | Year 3 | Year 4 | Total | |
|---|---|---|---|---|---|
| 2013-2014 | $2,372,994 | $2,781,695 | $2,429,321 | $2,725,785 | $10,309,795 |
| 2014-2015 | $2,450,470 | $2,289,069 | $2,871,229 | $3,534,244 | $11,145,012 |
| 2015-2016 | $2,700,169 | $2,792,715 | $2,839,851 | $3,853,161 | $12,185,895 |
| 2016-2017 | $1,662,682 | $2,335,933 | $2,570,428 | $3,644,310 | $10,213,353 |
| 2017-2018 | $2,642,454 | $2,545,499 | $2,913,413 | $3,940,729 | $12,042,095 |
| 2018-2019 | $3,788,693 | $3,831,175 | $3,132,480 | $5,515,858 | $16,268,206 |
| 2019-2020 | $3,276,486 | $2,948,170 | $3,053,491 | $2,818,938 | $12,097,086 |
| 2020-2021 | $2,304,384 | $1,964,819 | $1,890,917 | $2,141,321 | $8,301,441 |
| 2021-2022 | $3,435,158 | $2,493,033 | $2,845,083 | $3,313,700 | $12,086,974 |
| 2022-2023 | $3,315,040 | $2,693,048 | $2,771,546 | $2,461,264 | $11,240,897 |
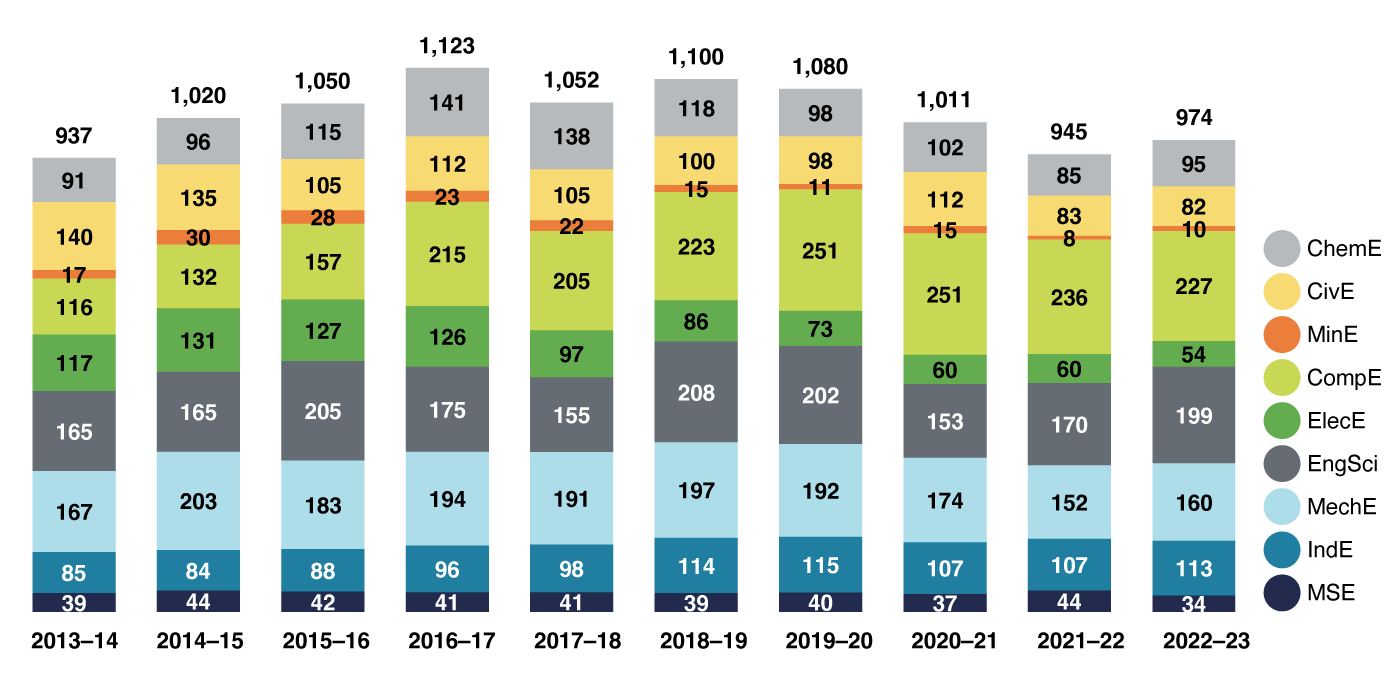
Figure 1.10a Number of Students and Percentage of Class Graduating with Honours, 2014 to 2023
Students are normally eligible to be considered for Honours standing only if they are carrying a full academic load (2.5 credits per session, excluding extra courses) and if the session is not being repeated. During fourth year, a student may reduce their course load in either semester (but not both) and still be eligible for Honours standing, provided the other conditions are met.
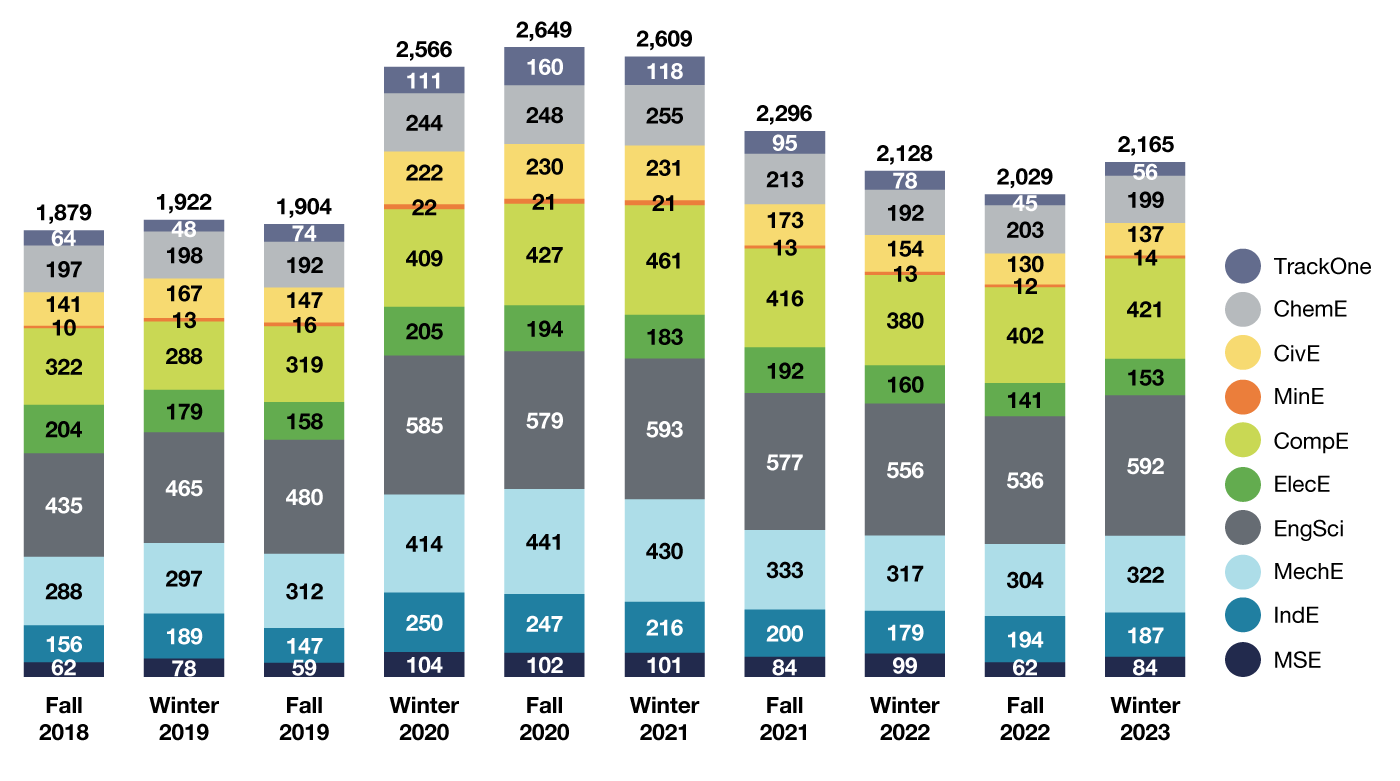
Figure 1.10b Number of Students on the Dean’s Honour List by Term and Academic Area, Fall 2018 to Winter 2023
The results for 2020 Winter, 2020 Fall, and 2021 Winter reflect various impacts due to COVID-19 adaptations. Moving all classes to online formats necessitated adjustments both to specific assignments and to overall grading schemes. For 2020 Winter only, students were permitted to apply a Credit or No Credit (CR/NCR) option, rather than a percentage grade, to any of their courses, or even to drop a failed course, after seeing their final grades. Sessional grades used to determine honour status were calculated using only those courses that students chose to have recorded as a percentage grade. A minimum of 4 such percentage grades were required to be considered for the Dean’s Honour List. For the 2020–2021 academic year, the CR/NCR option was discontinued, but the extended Late Withdrawal option was retained. Provision was also made for part-time students to achieve Dean’s Honour List standing. From the 2021-2022 academic year, the Late Withdrawal option was discontinued.
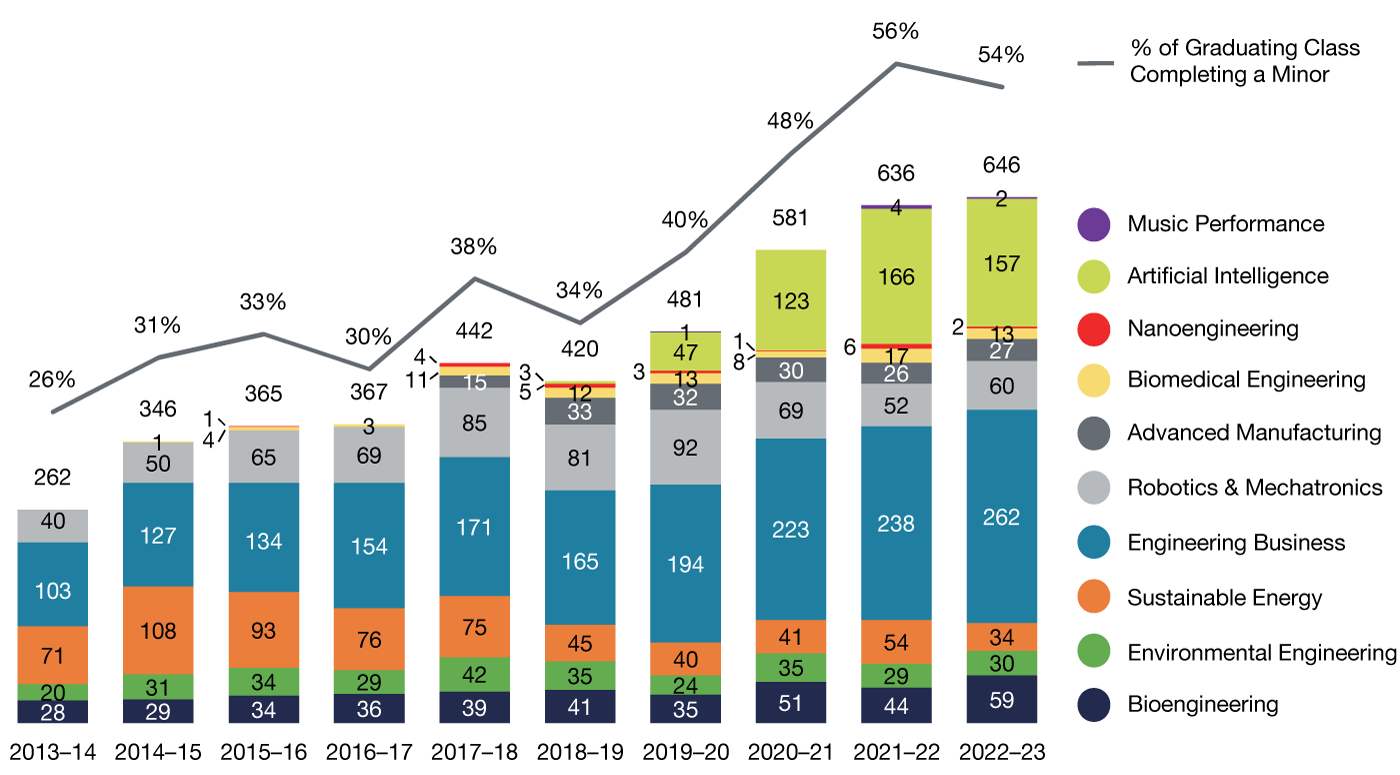
Figure 1.11a Number of Students and Percentage of Graduating Class Completing an Engineering Minor, 2013–2014 to 2022–2023
A total of 646 minors were completed by 525 students in 2022–2023, with many students completing more than one minor. In total, 740 students completed at least one minor or certificate, comprising 76% of the graduating class.
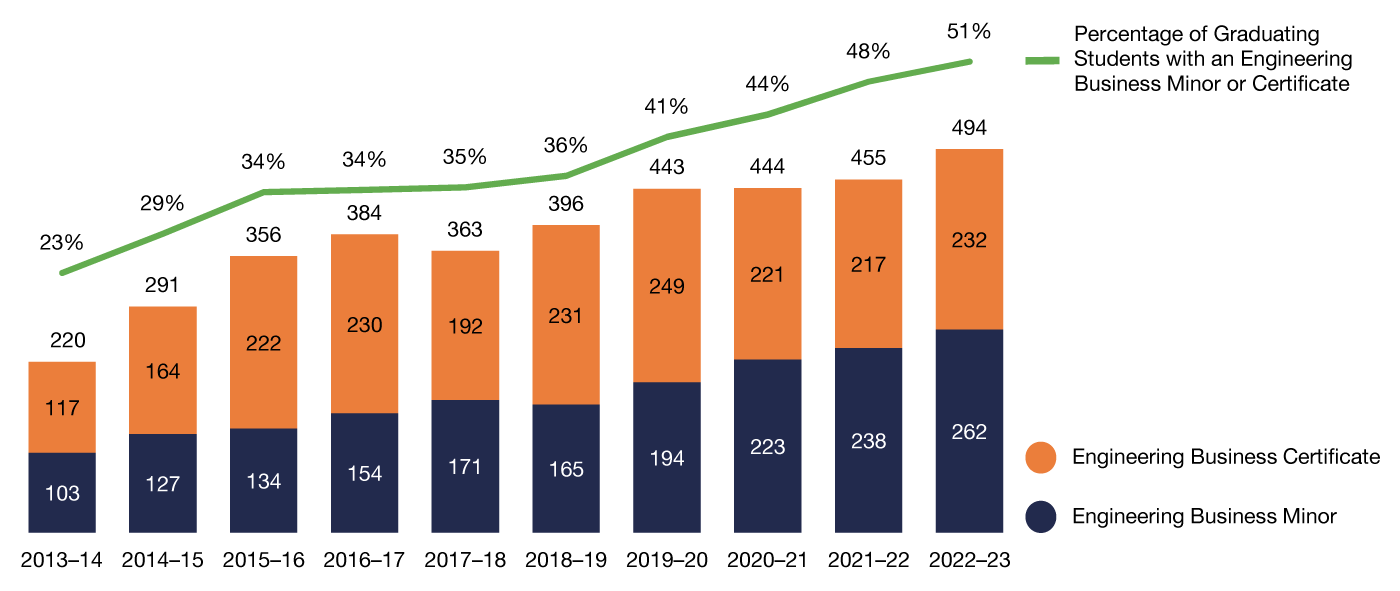
Figure 1.11b Students Graduating with an Engineering Business Minor or Certificate, 2013–2014 to 2022–2023
Figure 1.12 New Undergraduate Courses Launched, 2022–2023
| Course | Title |
|---|---|
| APS330H1 | Interdisciplinary Studies for Sustainability & Innovation |
| APS521H1 | Building Organizations: An Engineer's Business Toolkit |
| CIV501H1 | Building Energy Performance Simulation |
| ECE441H1 | Interfacing & Modulating the Nervous System |
| MAT238H1 | Differential Equations and Discrete Math |
| MIE223H1 | Data Science |
| MIE245H1 | Data Structures & Algorithms |
| MIE524H1 | Data Mining |
| MIE535H1 | Electrification Through Electricity Markets |
| MIN201H1 | Mineral Engineering Field Excursion |

