By the Numbers 2023
Explore comprehensive visual data about the Faculty in this companion piece to our 2023 Impact Report
Chapter 2: Graduate Studies
Data in this chapter are presented by academic year (September to August) unless otherwise noted.
Facts & Figures
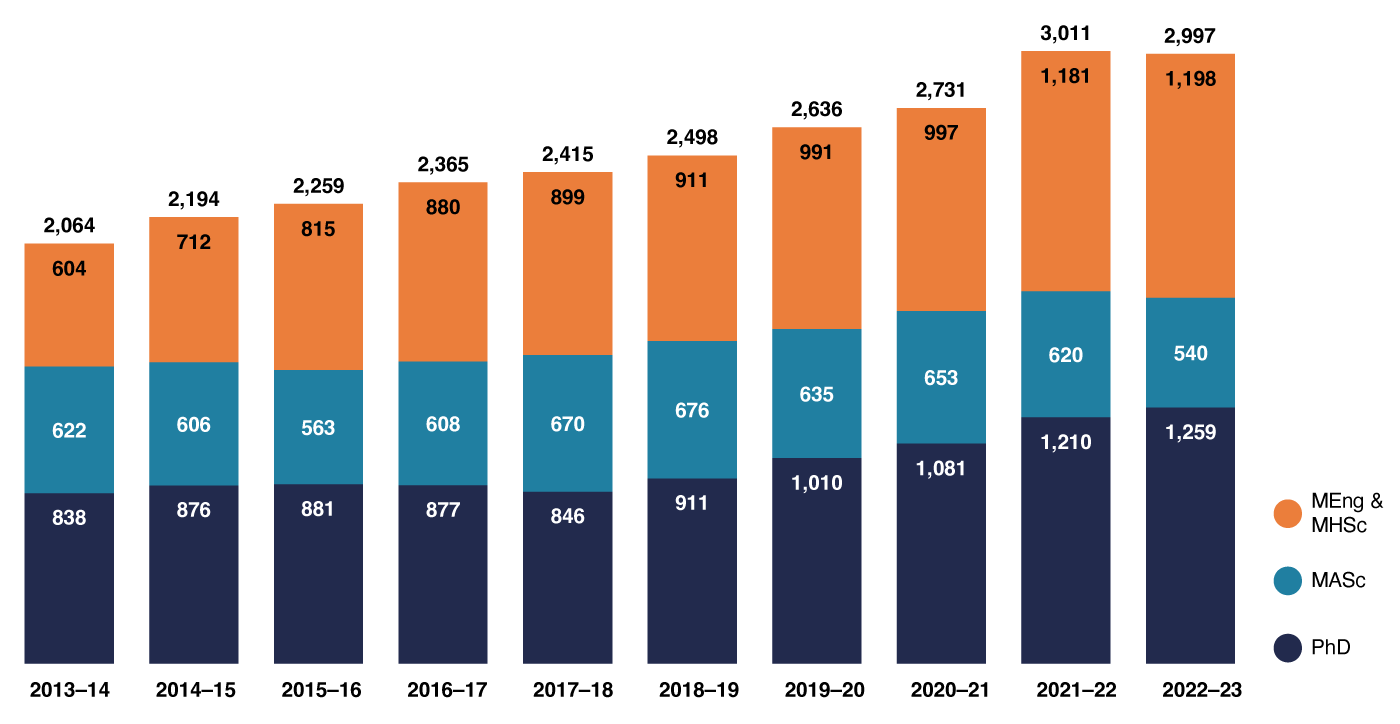
1,198
MEng students, double the number that were enrolled ten years ago
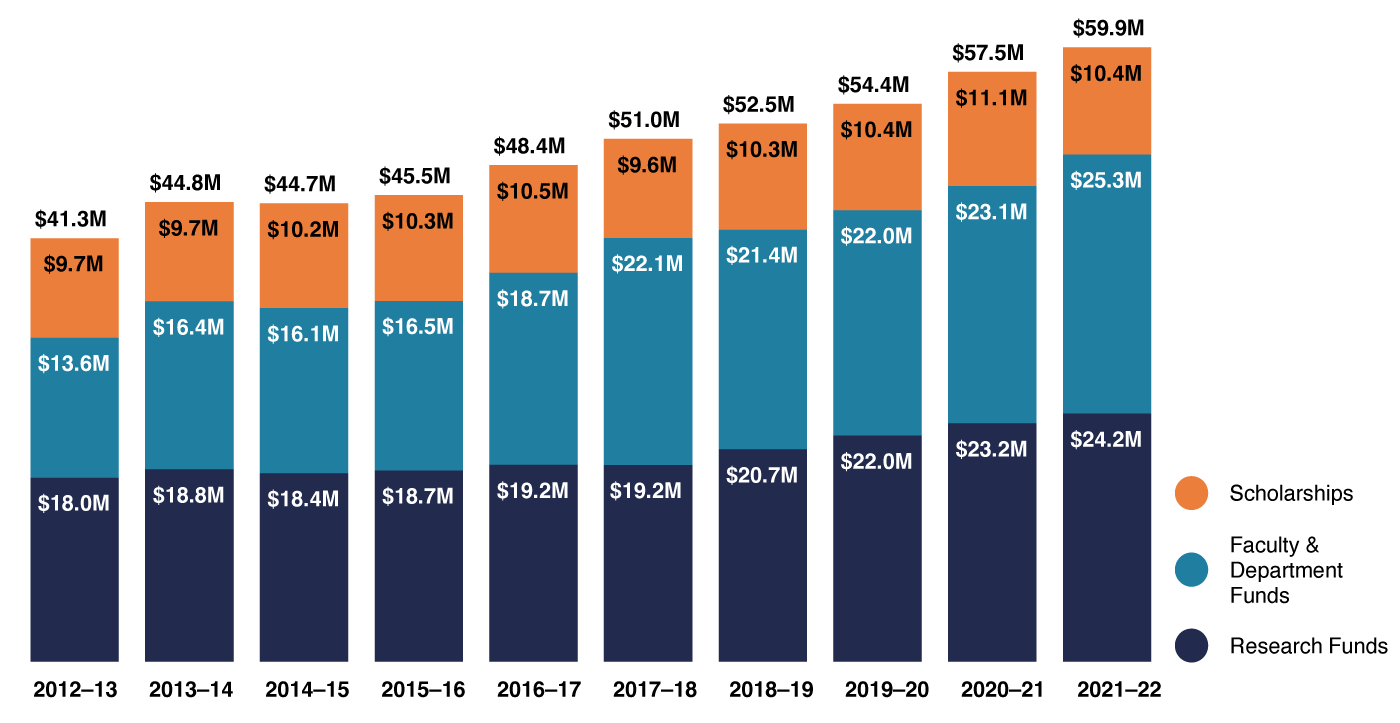
$59.9M
Total graduate student funding, an all-time high and an increase of 45.0% over the past ten years
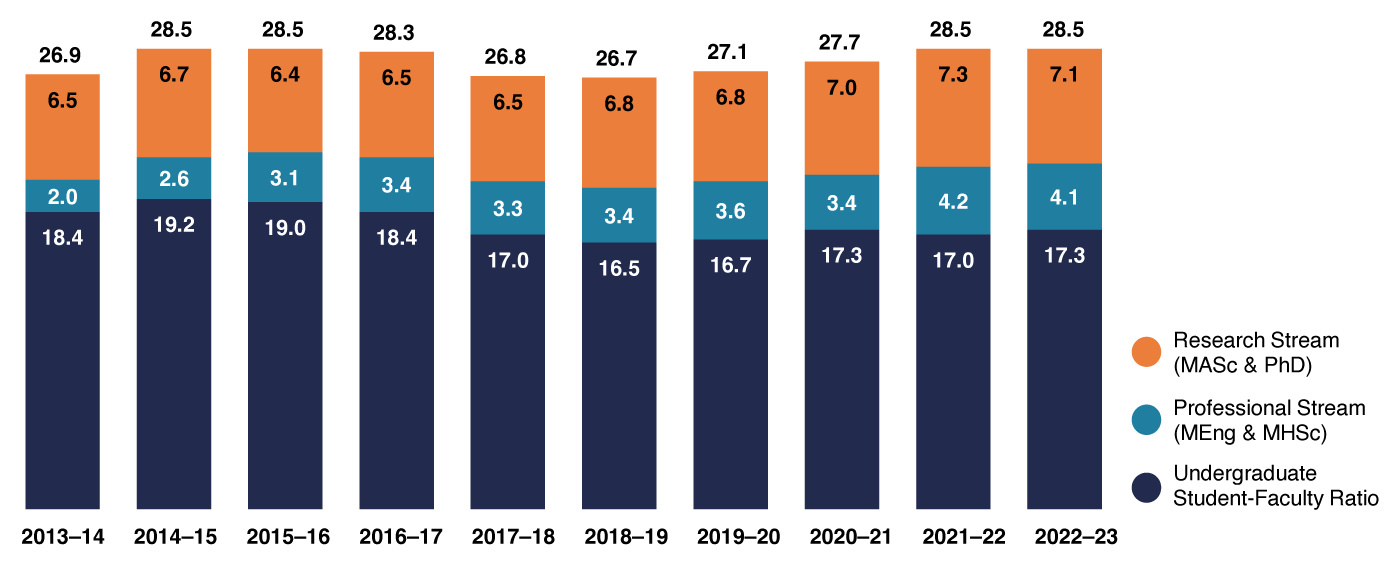
7.1
Average graduate student-to-faculty ratio, representing larger lab groups with a greater potential for impactful research
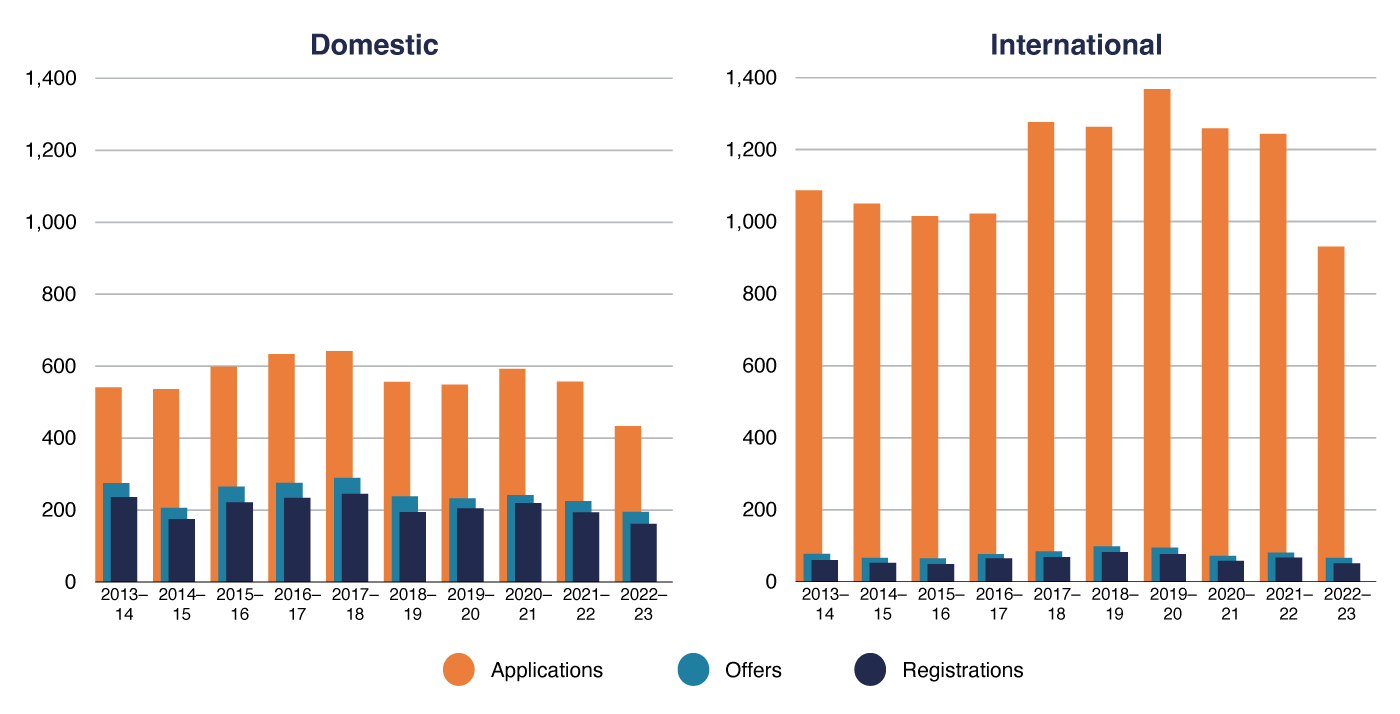
Figure 2.1a Domestic and International MASc Students: Applications, Offers, Registrations, Selectivity and Yield, 2013–2014 to 2022–2023
Applications and offers include those received between May and April of the listed academic year. Registrations are shown as of November 1. Selectivity = offers ÷ applications and represents the proportion of applicants who were offered admission. Yield = registration ÷ offers. Domestic students are defined as citizens (living in Canada or abroad) or permanent residents of Canada. Students who have fast-tracked from MASc programs into PhD programs are counted in these figures as applications, offers and admissions.
MASc Domestic Students
| Year | Applications | Offers | Registrations | Selectivity | Yield |
|---|---|---|---|---|---|
| 2013–2014 | 540 | 274 | 235 | 0.51 | 0.86 |
| 2014–2015 | 536 | 206 | 175 | 0.38 | 0.85 |
| 2015–2016 | 598 | 265 | 221 | 0.44 | 0.83 |
| 2016–2017 | 633 | 275 | 234 | 0.43 | 0.85 |
| 2017–2018 | 642 | 289 | 245 | 0.45 | 0.85 |
| 2018–2019 | 556 | 238 | 194 | 0.43 | 0.82 |
| 2019–2020 | 548 | 232 | 204 | 0.42 | 0.88 |
| 2020–2021 | 592 | 241 | 219 | 0.41 | 0.91 |
| 2021–2022 | 557 | 224 | 193 | 0.4 | 0.86 |
| 2022–2023 | 433 | 195 | 161 | 0.45 | 0.83 |
MASc International Students
| Year | Applications | Offers | Registrations | Selectivity | Yield |
|---|---|---|---|---|---|
| 2013–2014 | 1,086 | 77 | 60 | 0.07 | 0.78 |
| 2014–2015 | 1,050 | 66 | 52 | 0.06 | 0.79 |
| 2015–2016 | 1,015 | 65 | 48 | 0.06 | 0.74 |
| 2016–2017 | 1,022 | 76 | 65 | 0.07 | 0.86 |
| 2017–2018 | 1,276 | 84 | 68 | 0.07 | 0.81 |
| 2018–2019 | 1,263 | 98 | 82 | 0.08 | 0.84 |
| 2019–2020 | 1,367 | 94 | 76 | 0.07 | 0.81 |
| 2020–2021 | 1,258 | 72 | 58 | 0.06 | 0.81 |
| 2021–2022 | 1,244 | 80 | 67 | 0.06 | 0.84 |
| 2022–2023 | 930 | 66 | 51 | 0.07 | 0.77 |
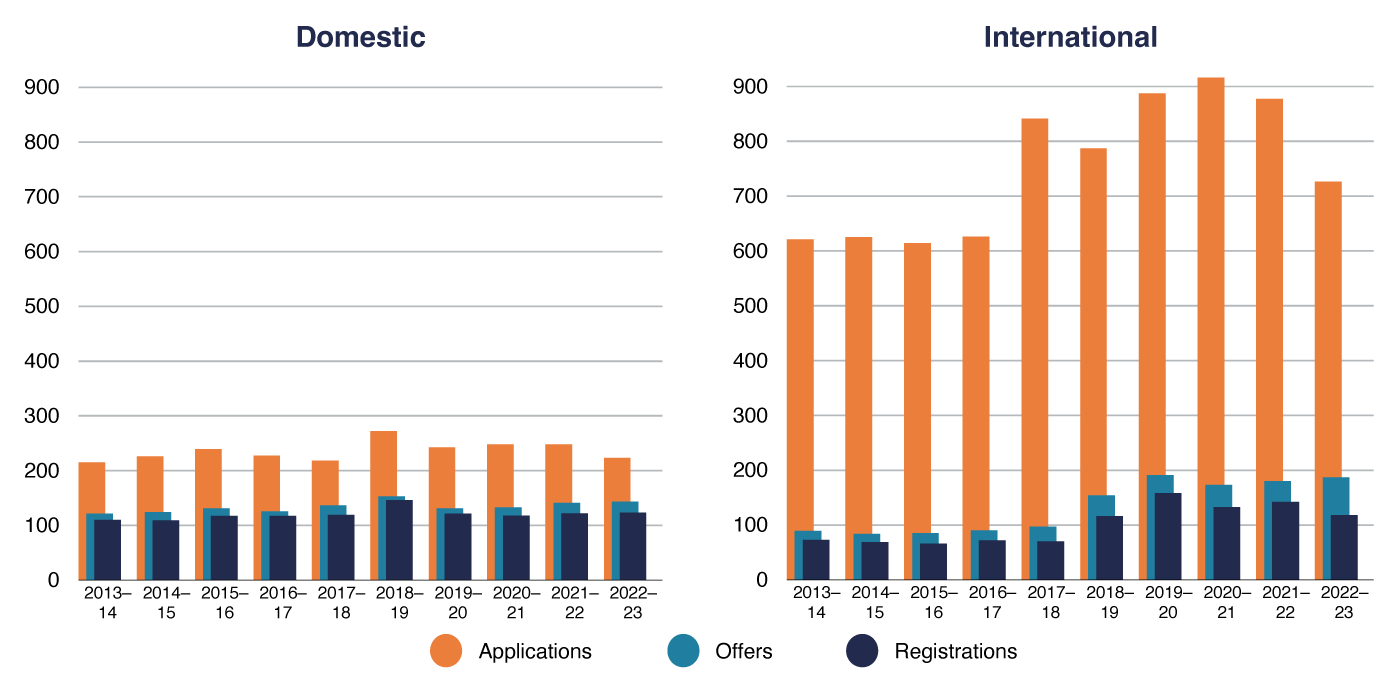
Figure 2.1b Domestic and International PhD Students: Applications, Offers, Registrations, Selectivity and Yield, 2013–2014 to 2022–2023
Applications and offers include those received between May and April of the listed academic year. Registrations are shown as of November 1. Selectivity = offers ÷ applications and represents the proportion of applicants who were offered admission. Yield = registration ÷ offers. Domestic students are defined as citizens (living in Canada or abroad) or permanent residents of Canada. Students who have fast-tracked from MASc programs into PhD programs are counted in these figures as applications, offers and admissions.
PhD Domestic Students
| Year | Applications | Offers | Registrations | Selectivity | Yield |
|---|---|---|---|---|---|
| 2013–2014 | 215 | 121 | 110 | 0.56 | 0.91 |
| 2014–2015 | 226 | 124 | 109 | 0.55 | 0.88 |
| 2015–2016 | 239 | 131 | 117 | 0.55 | 0.89 |
| 2016–2017 | 227 | 125 | 117 | 0.55 | 0.94 |
| 2017–2018 | 218 | 136 | 119 | 0.62 | 0.88 |
| 2018–2019 | 272 | 153 | 146 | 0.56 | 0.95 |
| 2019–2020 | 242 | 131 | 121 | 0.54 | 0.92 |
| 2020–2021 | 248 | 133 | 118 | 0.54 | 0.89 |
| 2021–2022 | 248 | 141 | 122 | 0.57 | 0.87 |
| 2022–2023 | 223 | 143 | 123 | 0.64 | 0.86 |
PhD International Students
| Year | Applications | Offers | Registrations | Selectivity | Yield |
|---|---|---|---|---|---|
| 2013–2014 | 621 | 89 | 73 | 0.14 | 0.82 |
| 2014–2015 | 625 | 84 | 69 | 0.13 | 0.82 |
| 2015–2016 | 614 | 85 | 66 | 0.14 | 0.78 |
| 2016–2017 | 626 | 90 | 72 | 0.14 | 0.8 |
| 2017–2018 | 841 | 97 | 70 | 0.12 | 0.72 |
| 2018–2019 | 787 | 154 | 116 | 0.2 | 0.75 |
| 2019–2020 | 887 | 191 | 158 | 0.22 | 0.83 |
| 2020–2021 | 916 | 173 | 133 | 0.19 | 0.77 |
| 2021–2022 | 877 | 180 | 142 | 0.21 | 0.79 |
| 2022–2023 | 726 | 187 | 118 | 0.26 | 0.63 |
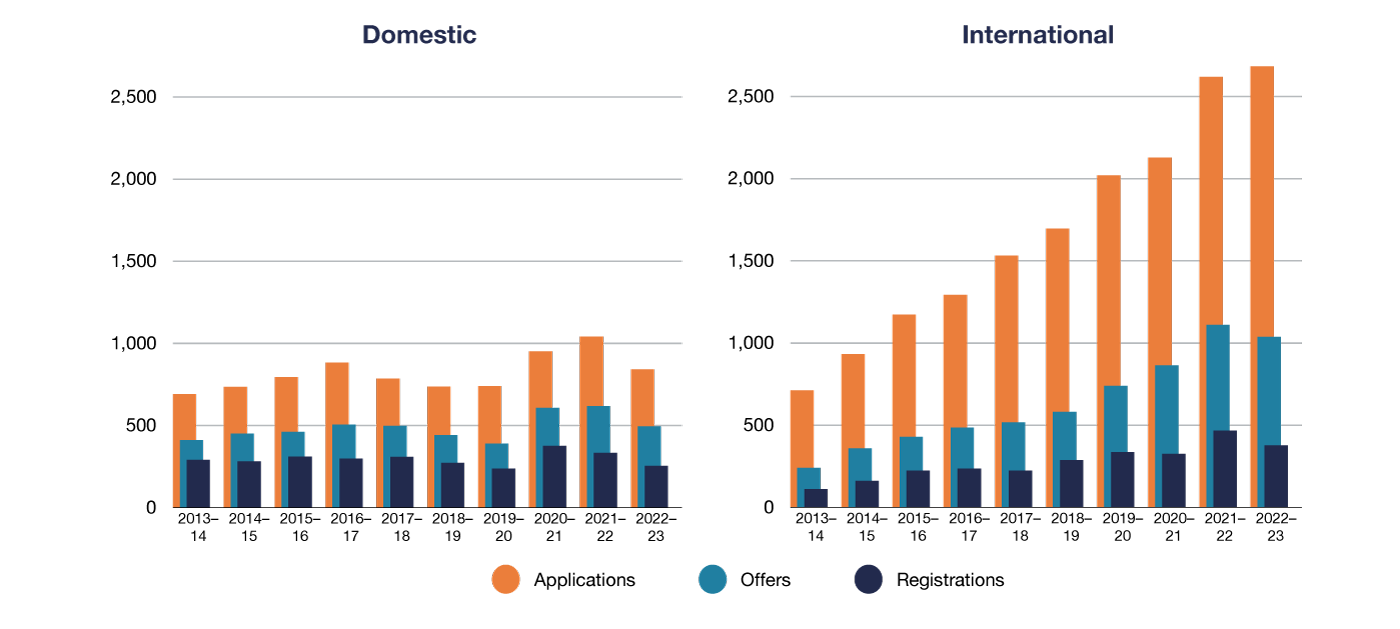
Figure 2.1c Domestic and International MEng and MHSc Students: Applications, Offers, Registrations, Selectivity and Yield, 2013–2014 to 2022–2023
Applications and offers include those received between May and April of the listed academic year. Registrations are shown as of November 1. Selectivity = offers ÷ applications and represents the proportion of applicants who were offered admission. Yield = registration ÷ offers. Domestic students are defined as citizens (living in Canada or abroad) or permanent residents of Canada. Students who have fast-tracked from MASc programs into PhD programs are counted in these figures as applications, offers and admissions. The MHSc program admitted its last students in 2019.
MEng and MHSc Domestic Students
| Year | Applications | Offers | Registrations | Selectivity | Yield |
|---|---|---|---|---|---|
| 2013–2014 | 692 | 411 | 290 | 0.59 | 0.71 |
| 2014–2015 | 734 | 450 | 282 | 0.61 | 0.63 |
| 2015–2016 | 794 | 461 | 311 | 0.58 | 0.67 |
| 2016–2017 | 881 | 506 | 299 | 0.57 | 0.59 |
| 2017–2018 | 784 | 498 | 309 | 0.64 | 0.62 |
| 2018–2019 | 737 | 441 | 272 | 0.6 | 0.62 |
| 2019–2020 | 739 | 388 | 236 | 0.53 | 0.61 |
| 2020–2021 | 951 | 607 | 375 | 0.64 | 0.62 |
| 2021–2022 | 1,041 | 617 | 333 | 0.59 | 0.54 |
| 2022–2023 | 841 | 494 | 254 | 0.59 | 0.51 |
MEng and MHSc International Students
| Year | Applications | Offers | Registrations | Selectivity | Yield |
|---|---|---|---|---|---|
| 2013–2014 | 711 | 240 | 112 | 0.34 | 0.47 |
| 2014–2015 | 932 | 359 | 162 | 0.39 | 0.45 |
| 2015–2016 | 1,171 | 429 | 223 | 0.37 | 0.52 |
| 2016–2017 | 1,292 | 486 | 235 | 0.38 | 0.48 |
| 2017–2018 | 1,531 | 517 | 224 | 0.34 | 0.43 |
| 2018–2019 | 1,695 | 580 | 287 | 0.34 | 0.49 |
| 2019–2020 | 2,019 | 739 | 335 | 0.37 | 0.45 |
| 2020–2021 | 2,127 | 862 | 325 | 0.41 | 0.38 |
| 2021–2022 | 2,617 | 1,109 | 468 | 0.42 | 0.42 |
| 2022–2023 | 2,682 | 1,037 | 377 | 0.39 | 0.36 |
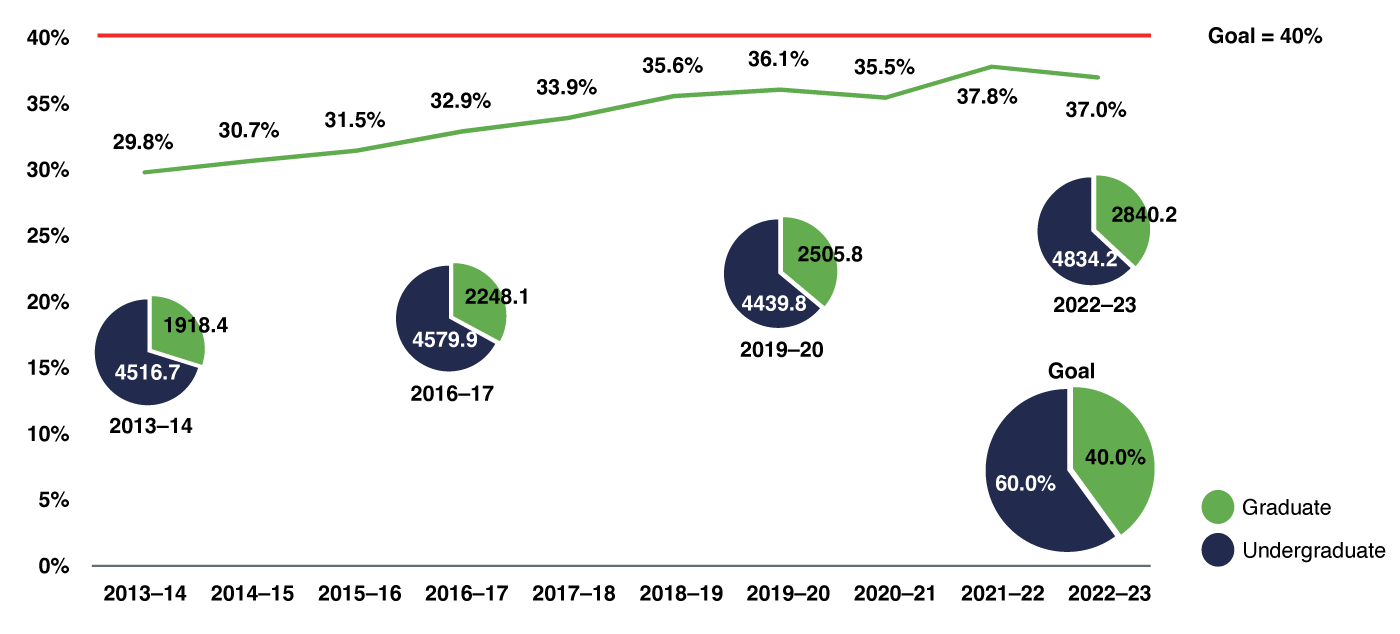
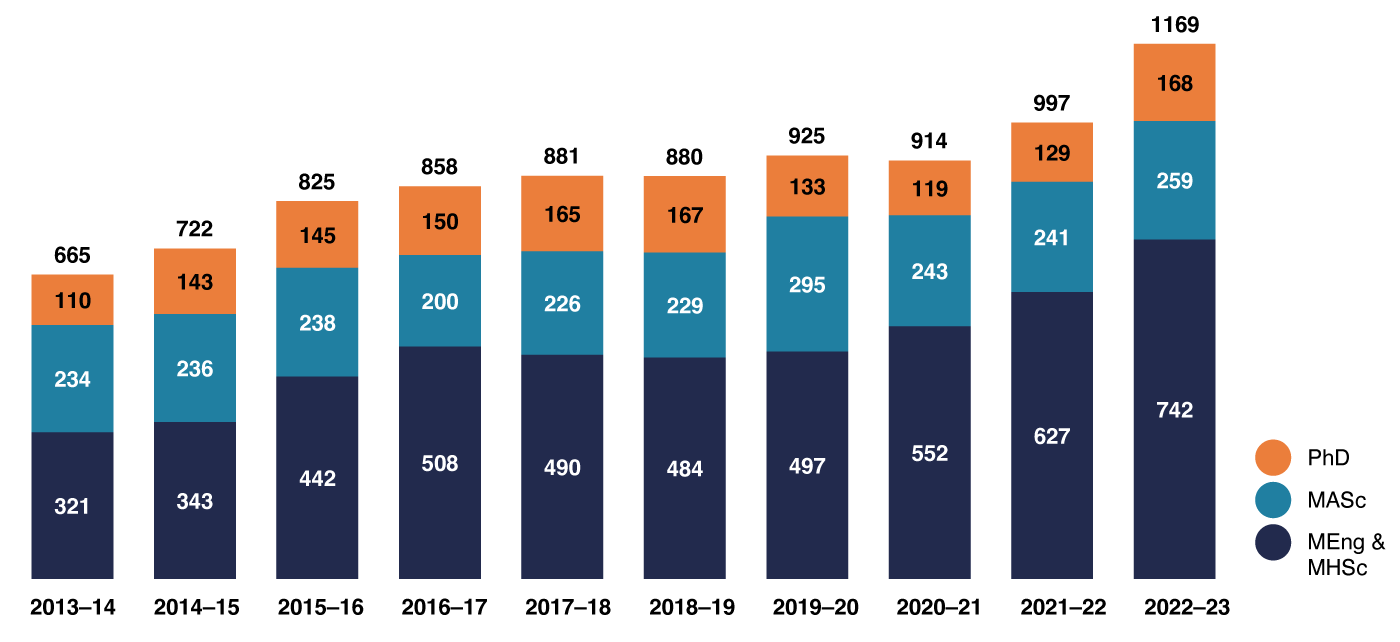
Figure 2.2b Graduate Enrolment by Full-Time Equivalent (FTE) and Headcount (HC) by Academic Area, 2013–2014 to 2022–2023
Student counts are shown as of November 1, 2022. All graduate students affiliated with ISTEP are part of collaborative programs with degrees granted by one of the other graduate divisions; in the figures in this chapter, these students are counted under their home division.
Year UTIAS BME ChemE CivMin ECE MIE MSE Total
2013–2014 FTE 162.1 219.0 209.9 290.5 509.8 436.2 90.9 1,918.4
HC 167 219 219 322 556 488 93 2,064
2014–2015 FTE 182.4 228.0 238.0 293.1 531.5 511.2 80.3 2,064.5
HC 188 228 245 312 577 563 81 2,194
2015–2016 FTE 143.2 241.0 253.0 299.4 591.5 532.9 79.0 2,140.0
HC 146 241 260 326 637 570 79 2,259
2016–2017 FTE 178.2 269.0 245.0 306.3 577.0 580.3 92.3 2,248.1
HC 181 269 252 335 619 616 93 2,365
2017–2018 FTE 170.1 296.0 246.7 313.0 551.5 602.8 94.9 2,275.0
HC 175 303 253 348 597 642 97 2,415
2018–2019 FTE 191.4 283.3 219.5 304.0 618.8 658.0 94.9 2,369.9
HC 197 291 223 332 658 700 97 2,498
2019–2020 FTE 226.2 327.1 235.0 349.9 630.2 641.8 95.6 2,505.8
HC 236 332 242 380 668 681 97 2,636
2020–2021 FTE 258.8 350.9 229.0 371.8 613.8 657.8 101.9 2,584.0
HC 270 353 236 404 653 711 104 2,731
2021–2022 FTE 279.6 360.5 239.0 396.7 664.0 812.6 117.2 2,869.6
HC 288 364 246 424 706 863 120 3,011
2022–2023 FTE 234.0 349.2 254.3 338.6 768.3 770.9 124.9 2,840.2
HC 241 352 262 361 825 829 127 2,997
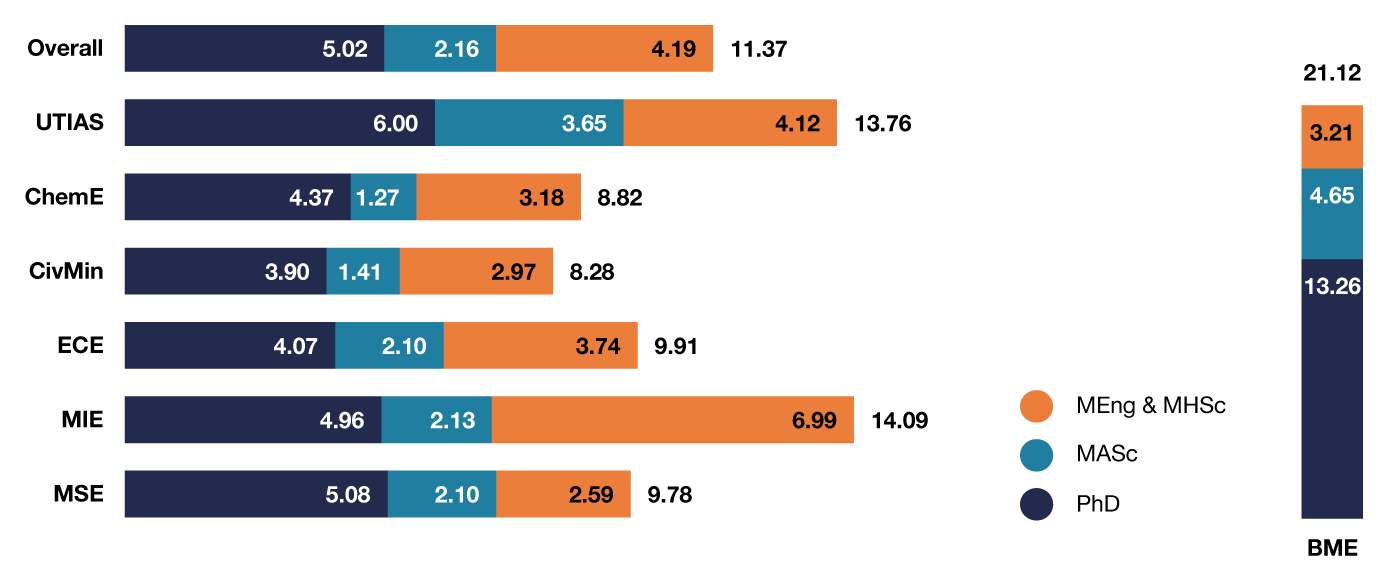
Figure 2.3b Full-Time Equivalent Graduate Student-to-Faculty Ratios by Academic Area and Degree Type, 2022–2023
Some students in BME are supervised by faculty members from the Faculties of Medicine and Dentistry and affiliated hospitals, as well as from other departments within U of T Engineering. Because the ratio includes only faculty with a budgetary appointment in BME, comparisons with other Engineering departments are not possible. For that reason, this figure shows BME in a visually distinct way. In cases of inter-departmental supervision within the Faculty, PhD and MASc students are assigned 100% to their primary supervisor’s department. All graduate students affiliated with ISTEP are part of collaborative programs with degrees granted by one of the other graduate divisions; in the figures in this chapter, these students are counted under their home division.
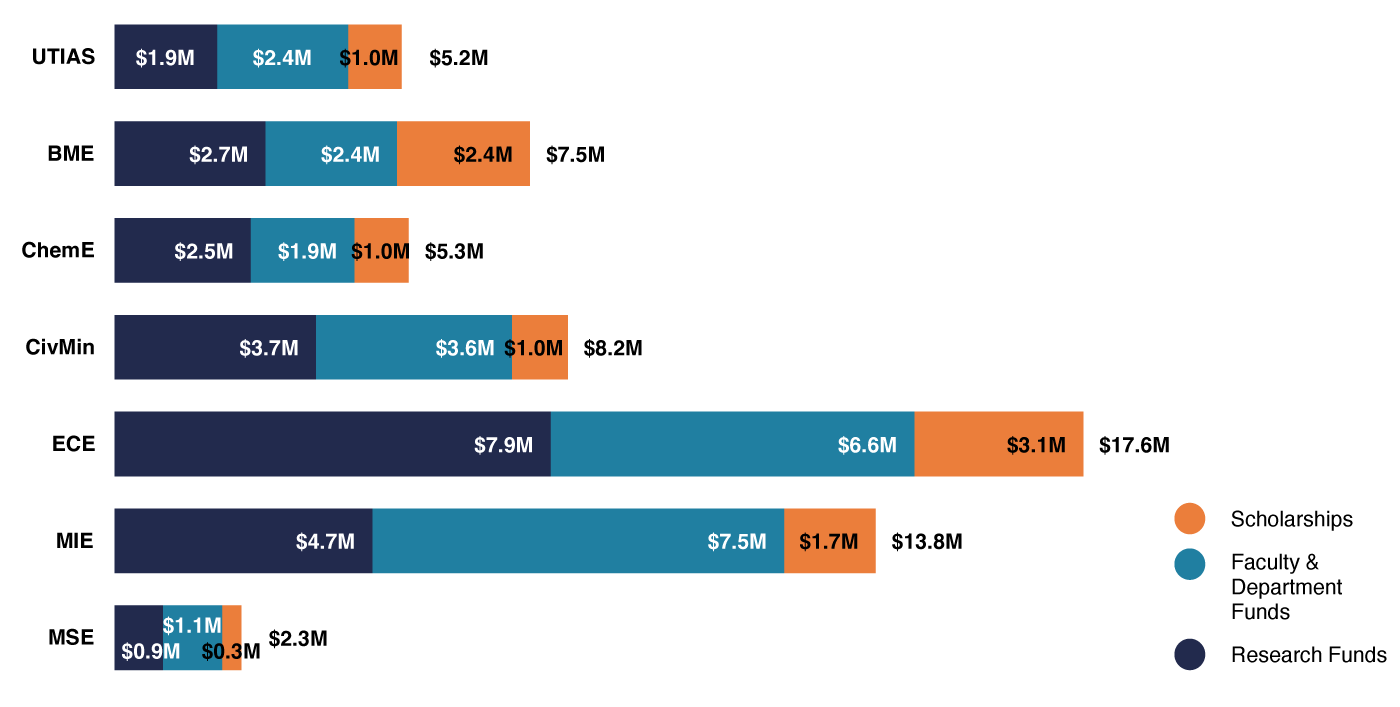
Figure 2.4b Graduate Student Funding by Category and Academic Area, 2021–2022
For graduate student funding figures, a slip year is used to include funding received during the summer term. All graduate students affiliated with ISTEP are part of collaborative programs with degrees granted by one of the other graduate divisions; in the figures in this chapter, these students are counted under their home division.
Figure 2.5a Total Graduate Student Scholarships by Source, 2012–2013 to 2021–2022
For graduate student funding figures, a slip year is used to include funding received during the summer term.
Year NSERC and CIHR OGS External – Other Internal Total
2012–2013 $3,513,185 $1,583,333 $171,154 $4,433,250 $9,700,922
2013–2014 $4,016,673 $1,236,666 $386,763 $4,026,715 $9,666,817
2014–2015 $3,975,701 $1,336,670 $403,762 $4,492,771 $10,208,904
2015–2016 $3,875,675 $1,223,331 $366,335 $4,818,839 $10,284,180
2016–2017 $3,539,878 $1,360,004 $333,919 $5,237,213 $10,471,014
2017–2018 $3,259,319 $1,525,000 $286,908 $4,571,797 $9,643,024
2018–2019 $3,390,489 $1,443,333 $508,399 $4,986,624 $10,328,844
2019–2020 $3,593,330 $1,491,670 $490,855 $4,787,185 $10,363,040
2020–2021 $3,818,085 $1,418,336 $543,783 $5,342,621 $11,122,825
2021–2022 $3,318,493 $1,523,329 $323,674 $5,269,558 $10,435,054
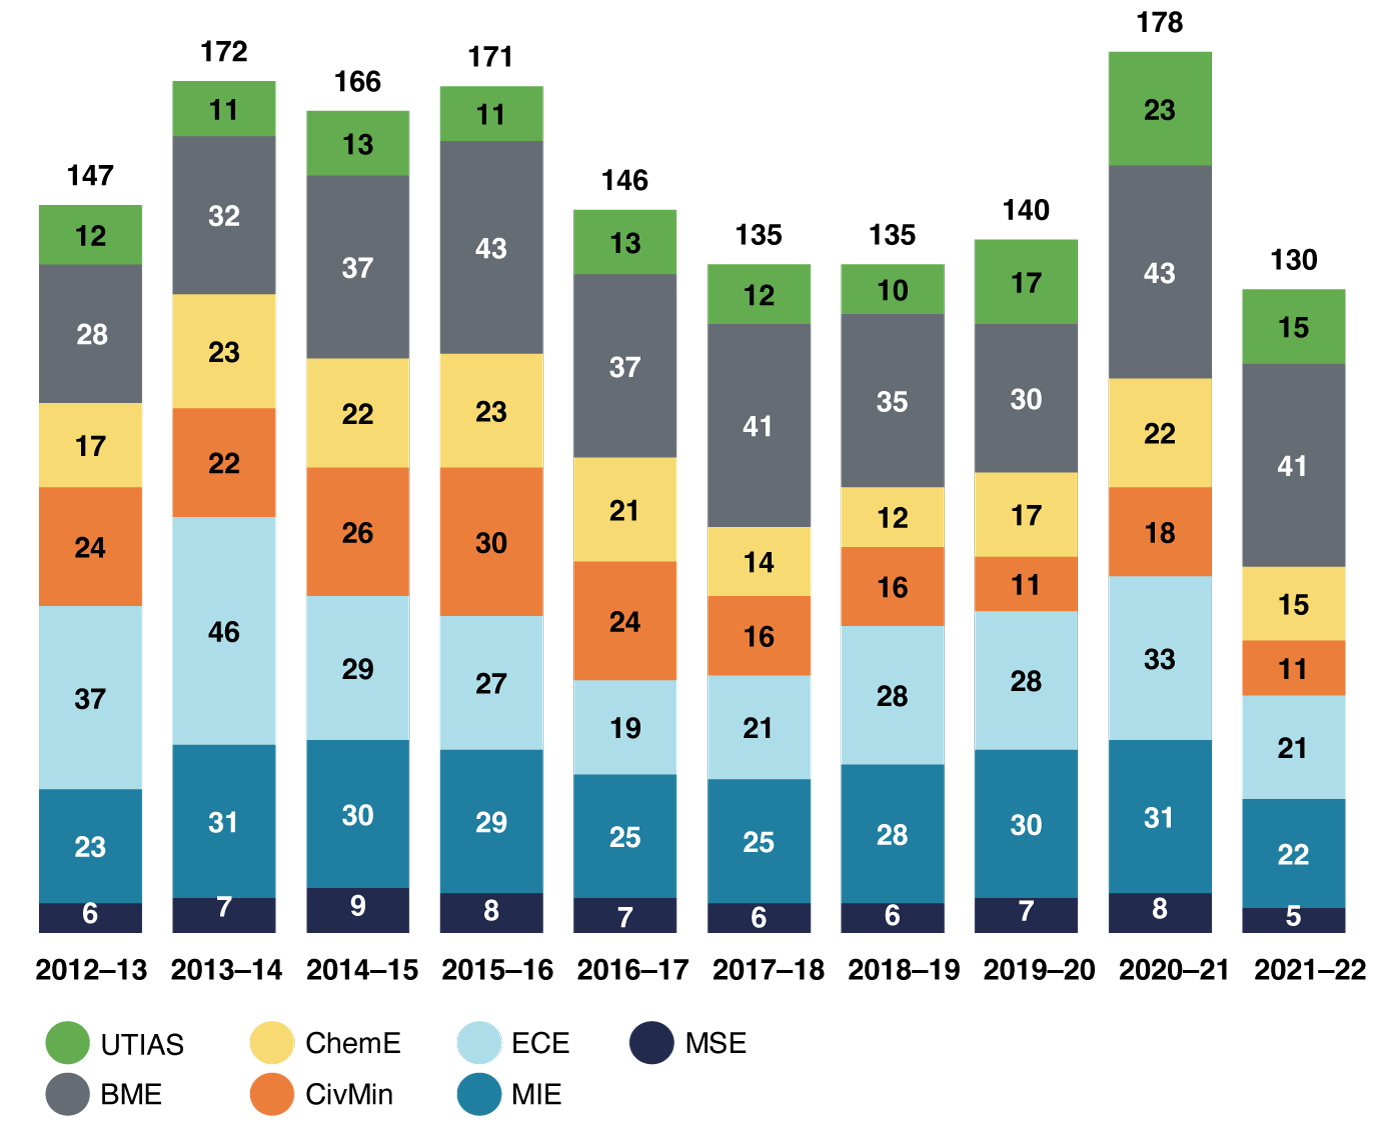
Figure 2.5b Number of NSERC and CIHR Graduate Student Award Recipients by Academic Area, 2012–2013 to 2021–2022
For graduate student funding figures, a slip year is used to include funding received during the summer term. All graduate students affiliated with ISTEP are part of collaborative programs with degrees granted by one of the other graduate divisions; in the figures in this chapter, these students are counted under their home division.
Figure 2.6a Number of Students Fast-Tracked from Masters to PhD by Academic Area, 2013–2014 to 2022–2023
For counting purposes, the academic year is from May to April. All graduate students affiliated with ISTEP are part of collaborative programs with degrees granted by one of the other graduate divisions; in the figures in this chapter, these students are counted under their home division.
Year UTIAS BME ChemE CivMin ECE MIE MSE Total
2013–2014 6 8 14 3 4 5 3 43
2014–2015 10 12 8 1 5 2 4 42
2015–2016 1 14 5 5 4 8 2 39
2016–2017 3 8 7 5 3 13 2 41
2017–2018 10 11 5 7 6 6 45
2018–2019 5 15 6 3 14 3 46
2019–2020 6 4 6 2 11 3 2 34
2020–2021 9 11 7 4 12 7 50
2021–2022 11 7 3 3 13 12 3 52
2022–2023 8 14 5 8 5 10 2 52
Figure 2.6b Number of Direct-Entry PhD Students by Academic Area, 2013–2014 to 2022–2023
For counting purposes, the academic year is from May to April. All graduate students affiliated with ISTEP are part of collaborative programs with degrees granted by one of the other graduate divisions; in the figures in this chapter, these students are counted under their home division.
Year UTIAS BME ChemE CivMin ECE MIE MSE Total
2013–2014 7 7
2014–2015 3 2 5
2015–2016 5 5 2 12
2016–2017 7 1 1 2 4 15
2017–2018 11 2 13
2018–2019 9 12 2 2 2 27
2019–2020 2 21 7 4 4 3 41
2020–2021 1 23 6 2 3 3 5 43
2021–2022 19 7 3 3 2 2 36
2022–2023 1 15 6 3 2 5 4 36
Figure 2.7a Time to Completion for PhD, MASc, MEng and MHSc Students, 2013–2014 to 2022–2023
The MHSc program admitted its last students in 2019.
Year PhD MASc MEng & MHSc (FT) MEng (ExtFT) MEng (PT)
2013–2014 5.2 2 1 2
2014–2015 5.3 2 1 1.3 2
2015–2016 5.3 2 1 1.7 2
2016–2017 5.3 2 1 1.7 2.3
2017–2018 5 2 1 1.7 2
2018–2019 5.3 2 1 1.7 2
2019–2020 5 2 1 1.7 2
2020–2021 5.3 2 1 1.7 2
2021–2022 5.3 2 1 1.7 2
2022–2023 5 2 1 1.7 2
Figure 2.7b Time to Completion for Graduate Students – University of Toronto Institute for Aerospace Studies, 2013–2014 to 2022–2023
Year PhD MASc MEng (FT) MEng (Ext FT) MEng (PT)
2013–2014 5.3 2.2 1 1.3
2014–2015 5.7 2 1 1.7 2
2015–2016 6.3 2 1 1.7 2.3
2016–2017 5.3 2 1 1.7 3
2017–2018 5 2 1 1.7 3
2018–2019 5.8 2 1 1.7
2019–2020 6 2 1 1.7 2.3
2020–2021 5.7 2 1 1.7 2
2021–2022 6 2 1 1.7 2.2
2022–2023 5.8 2 1 1.7 2
Figure 2.7c Time to Completion for Graduate Students – Institute of Biomedical Engineering, 2013–2014 to 2022–2023
The MHSc program admitted its last students in 2019.
Year PhD MASc MEng (FT) MEng (Ext FT) MEng (PT) MHSc (FT)
2013–2014 5 2 2
2014–2015 6 2.3 2
2015–2016 5.7 2 2
2016–2017 5.2 2 2
2017–2018 5.3 2.3 1 2
2018–2019 5.5 2 1 1.3 2
2019–2020 6 2 1 1.7 2
2020–2021 6 2.3 1 1.7 2
2021–2022 5.7 2 1 1.3 2.3
2022–2023 6 2.2 1 1.7 1.3
Figure 2.7d Time to Completion for Graduate Students – Department of Chemical Engineering & Applied Chemistry, 2013–2014 to 2022–2023
Year PhD MASc MEng (FT) MEng (Ext FT) MEng (PT)
2013–2014 5.5 2 1 2
2014–2015 5.7 2 1 1.5 1.8
2015–2016 5.7 2.3 1 1.7 1.5
2016–2017 5.5 2 1 1.7 2
2017–2018 5.8 2 1 1.7 1.7
2018–2019 5.5 2 1 1.7 1.7
2019–2020 6.3 2 1 1.8
2020–2021 5.3 2.3 1 1.7 2
2021–2022 5 2.3 1 2 3
2022–2023 5.3 2.3 1 1.7 1.8
Figure 2.7e Time to Completion for Graduate Students – Department of Civil & Mineral Engineering, 2013–2014 to 2022–2023
Year PhD MASc MEng (FT) MEng (Ext FT) MEng (PT) MEngCEM (FT) MEngCEM (Ext FT)
2013–2014 5 2 1 2
2014–2015 5.3 2 1 1.3 1.7 1.3
2015–2016 5.3 2 1 1.7 2 1.3
2016–2017 5.7 2 1 1.3 2.2 1.3
2017–2018 5 2 1 1.3 2 1.3 1.3
2018–2019 5.2 2 1 1.3 1.7 1.3 1.5
2019–2020 4.3 2 1 1.3 2.3 1.3 1.7
2020–2021 5.3 2 1 1.3 2.2 1.3
2021–2022 5.7 2 1 1.5 2 1 1.7
2022–2023 5.3 2 1 1.3 2 1 1.5
Figure 2.7f Time to Completion for Graduate Students – The Edward S. Rogers Sr. Department of Electrical & Computer Engineering, 2013–2014 to 2022–2023
Year PhD MASc MEng (FT) MEng (Ext FT) MEng (PT)
2013–2014 5.3 2 1 2
2014–2015 5 2.3 1 1.3 2
2015–2016 5 2 1 1.3 2
2016–2017 5.3 2 1 1.3 2.3
2017–2018 5 2.3 1 1.7 2.7
2018–2019 5.3 2.3 1 1.3 2.3
2019–2020 5 2 1 1.3 2.3
2020–2021 5.5 2.3 1 1.7 2.3
2021–2022 5.7 2 1 1.3 2.3
2022–2023 5 2 1 1.7 2.3
Figure 2.7g Time to Completion for Graduate Students – Department of Mechanical & Industrial Engineering, 2013–2014 to 2022–2023
Year PhD MASc MEng (FT) MEng (Ext FT) MEng (PT) MEngDM (PT)
2013–2014 5 2 1 2 2.7
2014–2015 4.8 2 1 1.7 2 2.3
2015–2016 5 2 1 1.7 1.7 3.5
2016–2017 4.7 2 1 1.7 2.3 2.8
2017–2018 5 2 1 1.7 2 3
2018–2019 4.7 2 1 1.7 1.7
2019–2020 4.3 2 1 1.7 1.7
2020–2021 5 2 1 1.7 2
2021–2022 4.8 2 1 1.7 2
2022–2023 4.7 2 1 1.7 2
Figure 2.7h Time to Completion for Graduate Students – Department of Materials Science & Engineering, 2013–2014 to 2022–2023
Year PhD MASc MEng (FT) MEng (Ext FT) MEng (PT)
2013–2014 4.7 2.3 1 2.7
2014–2015 5.3 2 1 1.3 2.8
2015–2016 5.5 2 1 1.7
2016–2017 5.8 2 1 1.7
2017–2018 5.3 2 1 1.7
2018–2019 5.3 2 1 1.7 2
2019–2020 7 2.3 1 1.7
2020–2021 4.7 2.5 1 1.8
2021–2022 5.3 2.5 1 2
2022–2023 4.3 2.8 1 1.7 2
Figure 2.9 New Graduate Courses Approved, 2022–2023
Course Code Course Title
BME 1520 Applications of universal design for preventing injury
BME 1540 Designing and testing gaming technologies for rehabilitation
BME 1550 Regenerative medicine: Science, manufacturing and regulations
BME1560 AI in biomedical engineering
BME1580 Emerging topics in the application of digital technologies for chronic cardiorespiratory conditions
ECE 1660 Risk-aware and stochastic control theory with learning
MIE1242 Applied thermal management
MIE1416 Human factors in healthcare
MIE 1770 Artificial intelligence in automotive and manufacturing applications
MIE1771 Additive manufacturing in automotive and high-volume applications
ROB 1830 Collaborative specialization in robotics: Seminar series

