


By the Numbers 2023
Explore comprehensive visual data about the Faculty in this companion piece to our 2023 Impact Report
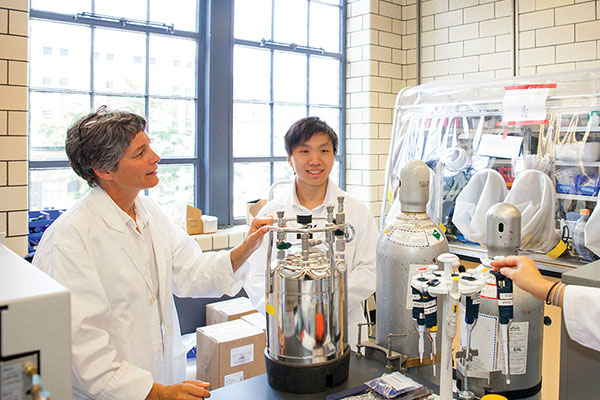
Chapter 7: Financial & Physical Resources
Data in this chapter are presented by fiscal year (May to April)
On this page
Facts & Figures
$247.1 M
Total revenue, 2022-2023
71,942
Square metres of space allocated to U of T Engineering
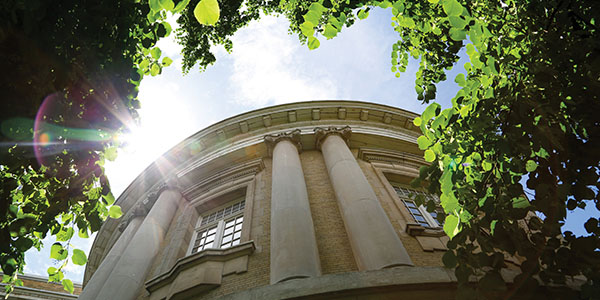
18
Buildings partly or wholly occupied by U of T Engineering, from the historic Sandford Fleming Building to the innovative Myhal Centre
Figure 7.1 Total Revenue, 2013–2014 to 2022–2023

Figure 7.2 Total Central Costs, 2013–2014 to 2022–2023

Figure 7.3 Budget Data, 2013–2014 to 2022–2023
| 2013–2014 | 2014–2015 | 2015–2016 | 2016–2017 | 2017–2018 | 2018–2019 | 2019–2020 | 2020–2021 | 2021–22 | 2022–23 | |
|---|---|---|---|---|---|---|---|---|---|---|
| Unrestricted Revenue (net of UF Contribution) | $145,880,955 | $157,376,069 | $168,313,333 | $178,459,435 | $184,836,509 | $189,960,978 | $185,052,620 | $193,218,344 | $202,902,197 | $214,788,927 |
| Restricted Revenue | $21,737,177 | $22,751,425 | $23,766,755 | $24,525,299 | $28,686,839 | $28,225,383 | $29,712,446 | $31,332,611 | $33,091,968 | $32,322,686 |
| Total Revenue | $167,618,132 | $180,127,494 | $192,080,088 | $202,984,733 | $213,523,348 | $218,186,361 | $214,765,067 | $224,550,955 | $235,994,165 | $247,111,613 |
| Divisional Recovery for Interdivisional Teaching | $6,042,335 | $5,084,764 | $5,028,443 | $11,067,206 | $10,910,265 | $8,720,807 | $8,828,754 | $9,359,026 | ||
| University-Wide Costs | $56,089,556 | $59,390,462 | $62,461,112 | $65,553,462 | $70,384,637 | $75,233,388 | $75,822,728 | $82,258,808 | $86,055,838 | $88,475,306 |
| Student Aid Levy | $12,539,417 | $13,093,888 | $13,541,938 | $13,793,571 | $14,716,594 | $15,542,692 | $15,703,617 | $17,749,925 | $19,562,608 | $21,732,620 |
| Total Central Costs | $68,628,973 | $72,484,350 | $76,003,050 | $79,347,033 | $85,101,231 | $90,776,080 | $91,526,344 | $100,008,733 | $105,618,445 | $110,207,926 |
| Net Revenue | $98,989,159 | $107,643,144 | $110,034,703 | $118,552,936 | $123,393,674 | $116,343,075 | $112,328,457 | $115,821,415 | $121,546,966 | $127,544,661 |
Figure 7.4 Revenue Sources, 2022–2023

Figure 7.5 Revenue Distribution, 2022–2023

Figure 7.6 Total Operating Budget: Breakdown by Expenses (Net of Central University Costs), 2022–2023

Figure 7.7 Summary of Buildings Occupied by Engineering and Total Net Assignable Square Metres (NASMs) Assigned to the Faculty of Applied Science & Engineering, 2022–2023
| Code | Building | Office of the Dean | EngSci | UTIAS | ChemE | CivE & MinE | ECE | BME | ISTEP | MIE | MSE | Total NASMs |
|---|---|---|---|---|---|---|---|---|---|---|---|---|
| AS | Aerospace (Downsview) | 5,289 | 5,289 | |||||||||
| BA | Bahen Centre | 1,561 | 581 | 67 | 5,528 | 1,665 | 9,402 | |||||
| DC | Donnelly CCBR | 667 | 889 | 1,556 | ||||||||
| ES | Earth Sciences | 164 | 164 | |||||||||
| EA | Engineering Annex | 241 | 924 | 91 | 1,256 | |||||||
| EL | Electrometal | 149 | 149 | |||||||||
| FI | Fields Institute | 332 | 332 | |||||||||
| GB | Galbraith | 1,520 | 5,312 | 4,318 | 39 | 11,189 | ||||||
| HA | Haultain | 35 | 198 | 110 | 727 | 721 | 1,790 | |||||
| M2 | MaRS West Tower | 136 | 1,285 | 1,285 | ||||||||
| MB | Lassonde Mining | 1,138 | 1,362 | 1,890 | 832 | 5,222 | ||||||
| MC | Mechanical Engineering | 63 | 5,384 | 5,447 | ||||||||
| MY | Myhal Centre | 5,234 | 573 | 5,807 | ||||||||
| PT | D.L. Pratt | 1,327 | 1,488 | 2,815 | ||||||||
| RS | Rosebrugh | 949 | 2,231 | 3,181 | ||||||||
| SF | Sandford Fleming | 629 | 692 | 1,558 | 3,547 | 137 | 6,564 | |||||
| WB | Wallberg | 340 | 8,299 | 130 | 1,381 | 10,151 | ||||||
| RM | 256 McCaul | 528 | 528 | |||||||||
| BY | 255 Beverley Street | 506 | 506 | |||||||||
| Total Area | 10,989 | 581 | 5,981 | 9,396 | 8,118 | 15,774 | 4,485 | 749 | 11,898 | 4,662 | 73,633 | |
| 73,633 NASMs (Net Assignable Square Metre) | ||||||||||||
Figure 7.8 Selected Infrastructure Investments, 2022–2023
| Project | Description | Progress |
|---|---|---|
| EngX – New Space for Industry Partnerships | This new facility, to be located at 88 College Street, will provide external partners with leased space and direct access to U of T Engineering’s expertise. EngX is one of eight project selected by the City of Toronto, in a competitive process, to participate in and be a beneficiary of its Deep Retrofit Challenge program to achieve maximum greenhouse gas (GHG) emissions reductions. | An architect for the project has been selected. The next step will be the procurement of a construction manager. |
| Canadian Centre for Research and Applications in Fluidic Technologies (C-CRAFT) | The C-CRAFT initiative, supported by the activities within the upgraded Toronto Nanofabrication Facility (TNFC), will foster translational collaborations in polymer-based micro-devices, human organs-on-chip systems, bio-manufactured tissues and semiconductor-based devices. | C-CRAFT consists of three renovated/consolidated lab facilities: - the 7th floor of the Bahen Centre (MIE’s CRAFT Device Foundry) - the former CMS facility on the 4th floor of the Mechanical Engineering Building upgraded to establish MIE’s CRAFT Tissue Foundry - a consolidated ECE TNFC facility on the 4th floor of the Pratt Building, relocated from the Bahen Centre’s 7th floor for the CRAFT Device Foundry The three projects are nearing completion and should be fully functional as U of T Core Facilities later this year. |
| Experiential Learning Commons | A new joint collaborative career centre, located on the third and fourth floors of 255 Beverly Street, includes accommodations for the Engineering Career Centre, as well as career support programs from the Faculty of Arts & Science and the Employer Relations Team from U of T’s Student Services. U of T Engineering funded one third of the cost to acquire the commercial condominium units, and one third of the capital cost to fit-out the shell space for the University’s Experiential Learning Centre. | Engineering Career Centre staff occupied their new spaces early March 2023, joining their colleagues from Arts & Sciences’ Experiential Learning & Outreach Support (ELOS) and Student Life’s Career Exploration & Education (CEE). |
| CivMin Adjustable Multi-dimensional (AMD) Loading System & Upgrade of Structural Testing Facilities in the Galbraith Building | The revitalization of the Structural Testing Facility in the Galbraith Building is part of a proposed long-term research project to establish a mega-scale Adjustable Multi-dimensional (AMD) experimental loading facility. The project is funded by a Canada Foundation for Innovation (CFI) Innovation Fund grant and by the Dean’s Strategic Fund. | Work on this project has continued throughout the 2022–2023 academic year. The demolition and alterations to construct a strong floor to support the new AMD are underway in the GB Structural Testing Facility. After completion, the next step will include the design, fabrication and site-assembly of the AMD itself. |
| ECE GB-405 Lab Renovations in the Galbraith Building | GB-405, a former classroom, is being renovated to carry out research in CO2 utilization and accelerated materials discovery. The lab will hold 30 trainees that need access to appropriate lab space with electrochemical workstations and characterization equipment. A variety of gases need to be supplied in the lab: air, nitrogen, carbon dioxide, and carbon monoxide. | The renovation is nearly complete. Deficiencies continue to be addressed to allow for beneficial occupancy and use, expected to take place later this summer. |
| Upgrading of two research labs in MC120 – Phase 1 | The first phase of a two-phase project to upgrade two spaces within the Energy Lab, MC120: -Led by Professor David Sinton (MIE), the CO2 Electrolyzer Pilot Plant (CERT) researches the removal of CO2 from the atmosphere using electrolytic principles and its subsequent conversion into commercially valuable products; -Led by Professor Cristina Amon (MIE), the Thermal Management Systems (TMS) Laboratory addresses the thermal management of battery and charging systems for electric vehicles. | The delivery of the 600 & 800 amp disconnect switches continues to be delayed. The three large cyclers in the TMS lab cannot be used until these switches are installed and approved by Toronto Hydro. Phase 2 will address the renewal of undergraduate labs throughout the remainder of MC120 in support of electric and autonomous vehicles and related emerging green technologies. |
| BME RS405-RS412 Lab Renovations in the Rosebrugh Building | The Rosebrugh Building's RS-405 to RS-412 have been converted from offices/seminar room to wet lab space, creating a state-of-the-art CL2 & Chem2 Immuno-engineering research space. | Functional testing and acceptance are nearing completion. This project is one in an overall BME program of projects that will improve the functionality and space utilization in the buildings it occupies. |
| MIE & ECE Myhal Centre Printed Circuit Board Prototyping & Fabrication Facility | Theis project involves the design & build of a printed circuit board prototyping & fabrication space that is needed by two of the Faculty’s academic departments (MIE & ECE). It will be located adjacent to the Faculty’s Light Fabrication Facility (LFF) on Level 400 of the Myhal Centre. | The project is underway. |
| Sanford Fleming Basement Atrium Renewal | A successful 2021 Student Spaces Enhancement Fund (SSEF) award enabled University Planning, Design & Construction to take on this joint Faculty/Engineering Society (EngSoc) project to renovate the basement area of Sandford Fleming, including the surrounding food court seating. | Two schematic design options are being prepared to renovate and refresh this student hub, one which adds a ramp for accessibility, the other of which raises the level of the lowest part of the Atrium. Many of the planned improvements will be common to both options such as the creation of individual all-gender toilet closets & one single-user Universal washroom. |
| Myhal Cantre Space Review | Five years after occupancy, and in light of new hybrid alternative work arrangements, the Faculty is undertaking a comprehensive space review to identify priorities and opportunities and recommend actions to improve effective use of space. | The review is underway and will inform the development of the Faculty’s new Academic Plan. |
| Faculty of Applied Science & Engineering Facilities Master Plan | The Facilities Master Plan (FMP) Study will build a comprehensive catalogue and assessment of current space use and future needs, outline renovation and improvement projects to respond to these needs, and identify larger capital investment through additions and new buildings, either through sole sponsorship or through partnership, across the University’s various campuses. The FASE FMP will complement and enforce the strategic visioning of the Academic Plan and establish a long-term vision for FASE and develop a framework that provides FASE with guidance for present and future space planning decisions. | The FMP Study will be conducted together with University Planning, Design & Construction through 2023 & 2024. |
Figure 7.9 The Engineering Neighbourhood
- BA – Bahen Centre
- BY – 255 Beverley Street
- DC – Donelly CCBR
- ES – Earth Sciences
- EA – Engineering Annex
- EL – Electrometallurgy Lab
- FI – Fields Institute
- GB – Galbraith Building
- HA – Haultain Building
- M2 – MaRS West Tower
- MB – Lassonde Mining Building
- MC – Mechanical Engineering Building
- MY – Myhal Centre
- PT – D. L. Pratt Building
- RM – 256 McCaul Street
- RS – Rosebrugh Building
- SF – Sandford Fleming Building
- WB – Wallberg Building
- UTIAS (Downsview) [not pictured]
